
A deep dive into EPO opposition representation reveals Germany and the UK dominate
Oral Proceedings are on the increase, with the Germans holding sway against an increasing British challenge. Wannes Weymiens reviews patentee and opponent nationalities in opposition procedures before the EPO during the 2017-2019 period.
European patents are increasingly important for businesses of all sizes. Filings of European patent applications increase every year (from 166,594 in 2017 to 181,406 in 2019, for example), while more European patents are being granted, which reached a record of 137,784 in 2019, an increase of 8% from 2018. What’s more, the diversity of applications is also on the rise. Applicants or patentees from non-EPC states grew from 52.71% in 2017 to 54.52% in 2019. The other side of the coin is that more businesses are finding European patents owned by others potentially hampering their freedom to operate. This is reflected in the steadily increasing number of oppositions filed at the EPO. For instance, there was an increase from 2,898 in 2015 to 3,412 in 2018. While the EPO’s annual reporting changed from 2019 onwards and no longer provides these numbers, from the data it seems that the total numbers of patents being opposed increased again in 2019. Historically, a few countries have provided the majority of patentees and opponents in opposition proceedings before the EPO. One could conclude that puts companies from those countries at a commercial advantage, as they more actively protect their innovations and their freedom to operate. This article looks at how companies from different countries make use of opposition proceedings at the EPO, either as patentees or as opponents, and how this changed between 2017 and 2019. It also reviews in which country the representatives used during opposition procedures in the same period are based.
PATENTEES
Figure 1 and Figure 2 represent the top European Patent Convention (EPC) and non-EPC nationalities (respectively) of the patentees in EPO opposition during the 2017-2019 period, ranked by their average percentage over the 2017-2019 period.
Figure 1 Top 10 patentee nationalities (EPC contracting states) in EPO opposition during the 2017-2019 period.
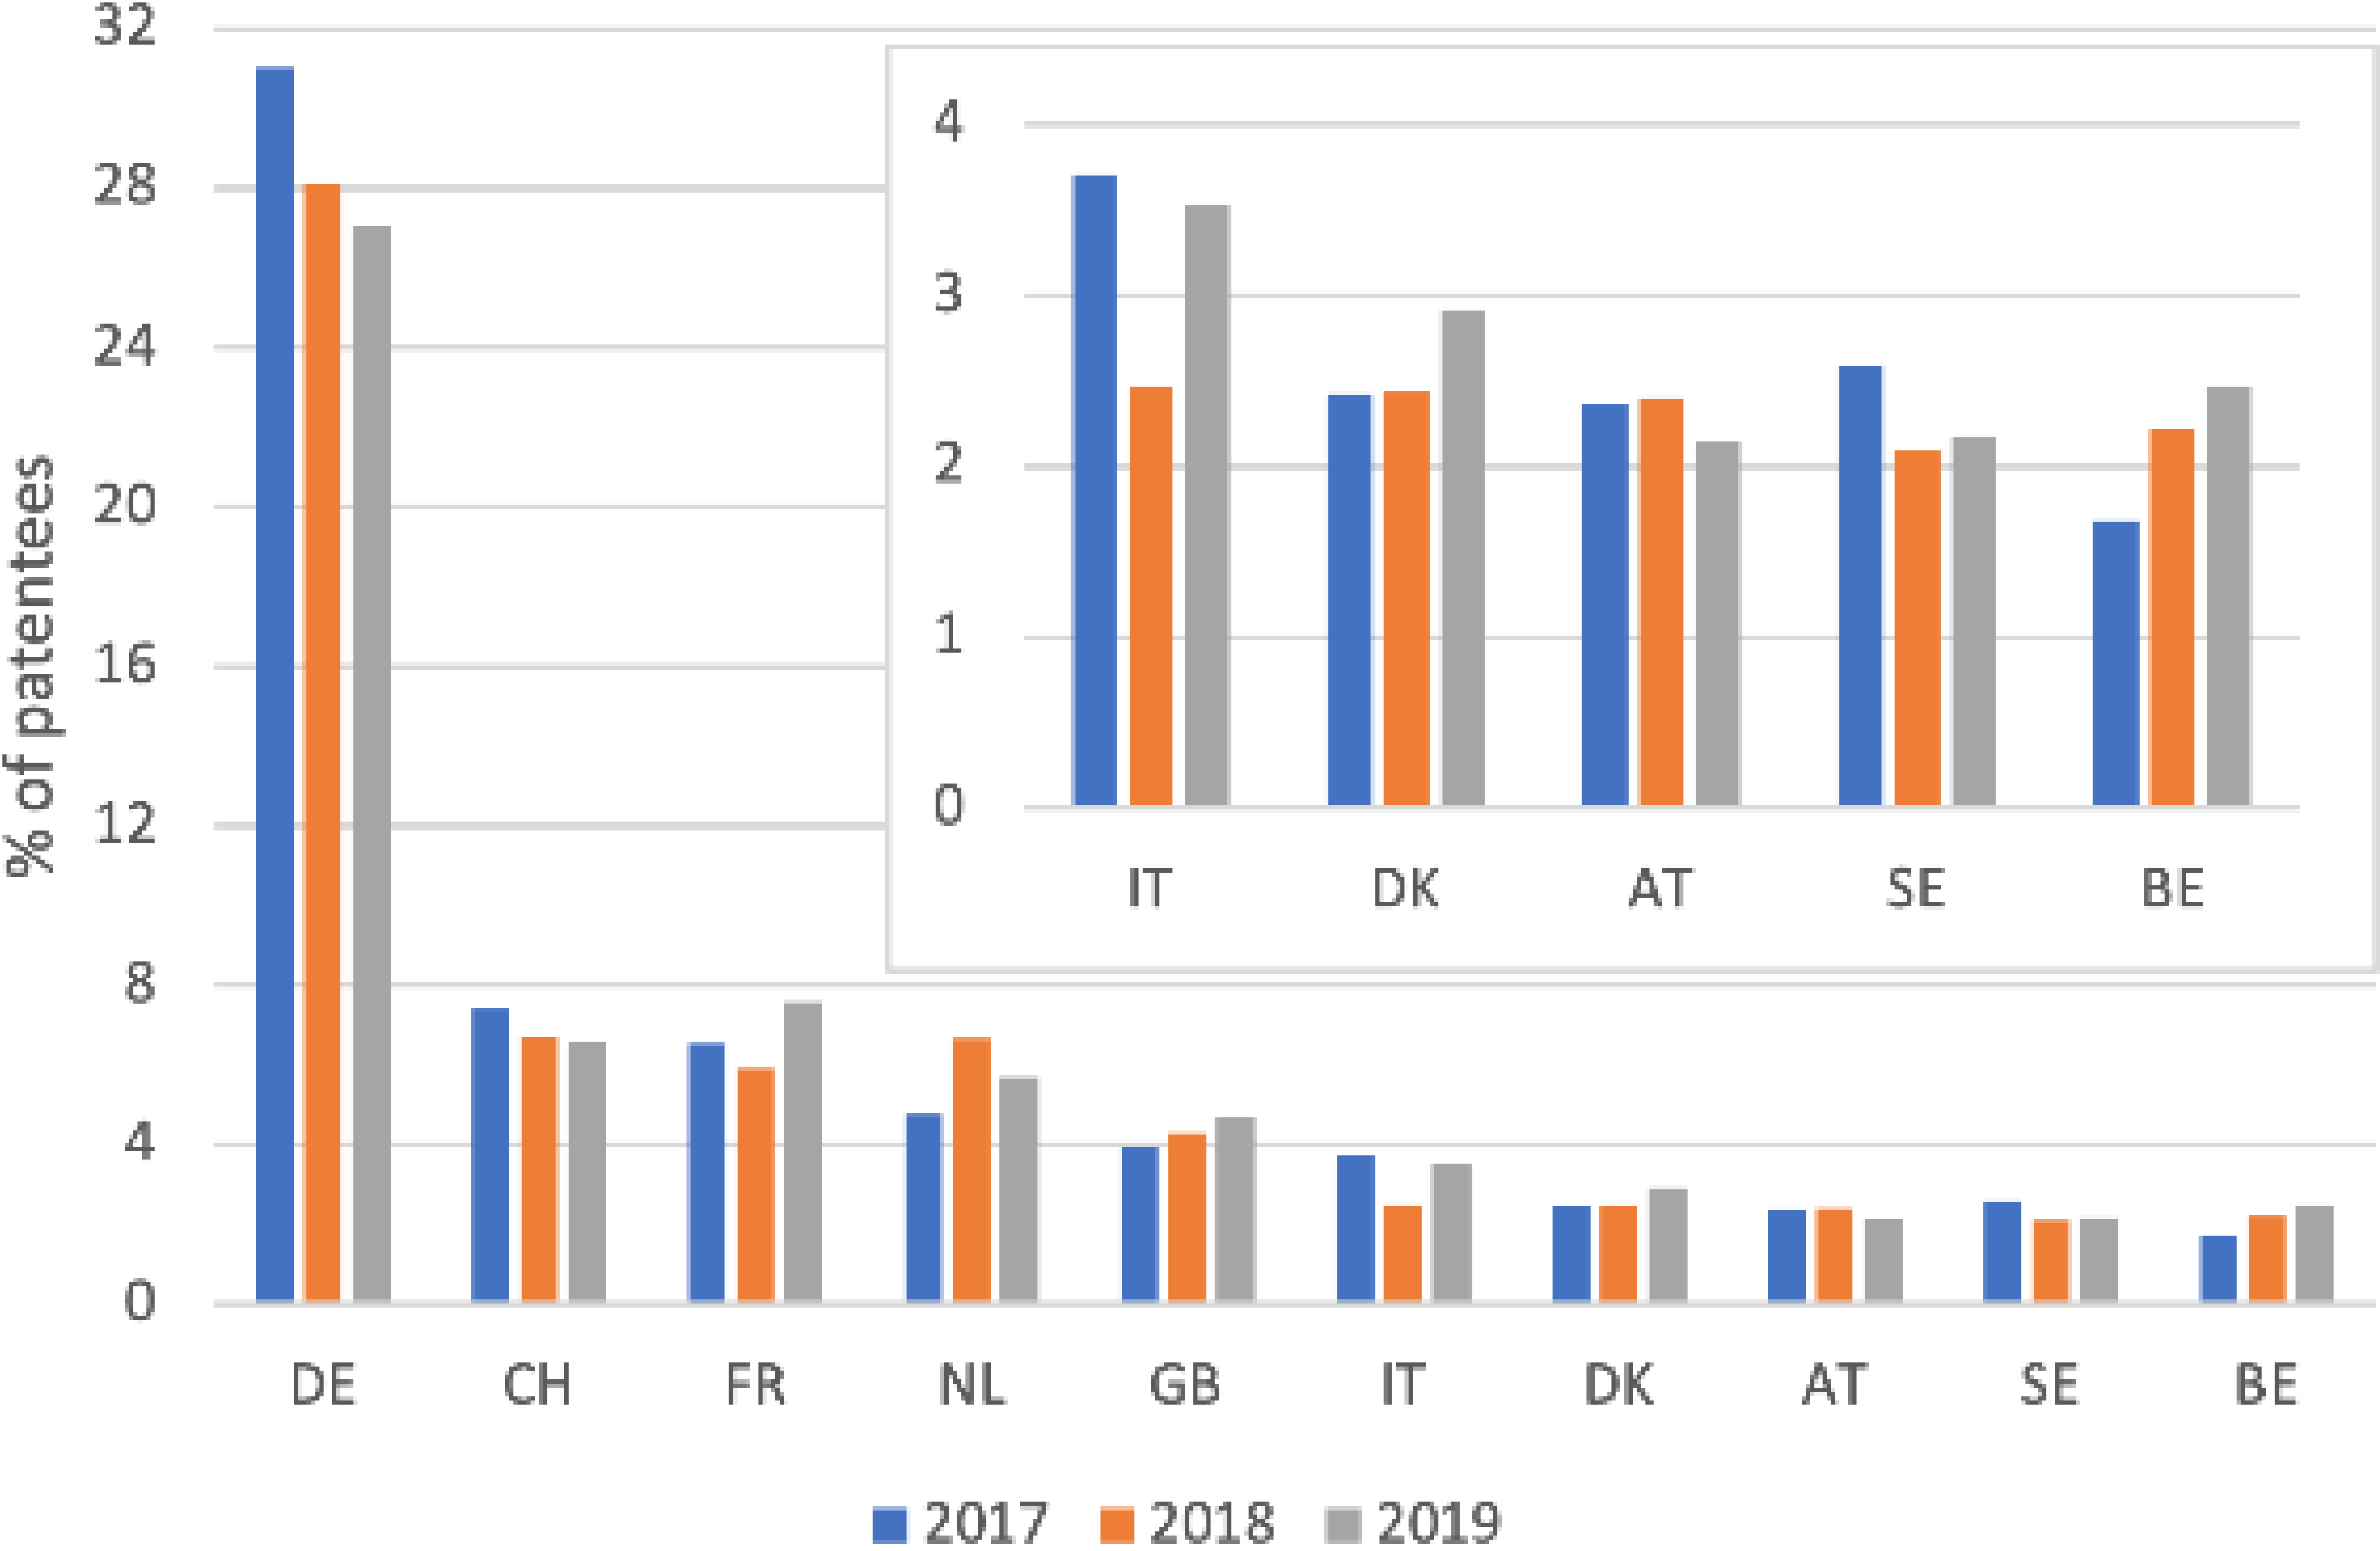
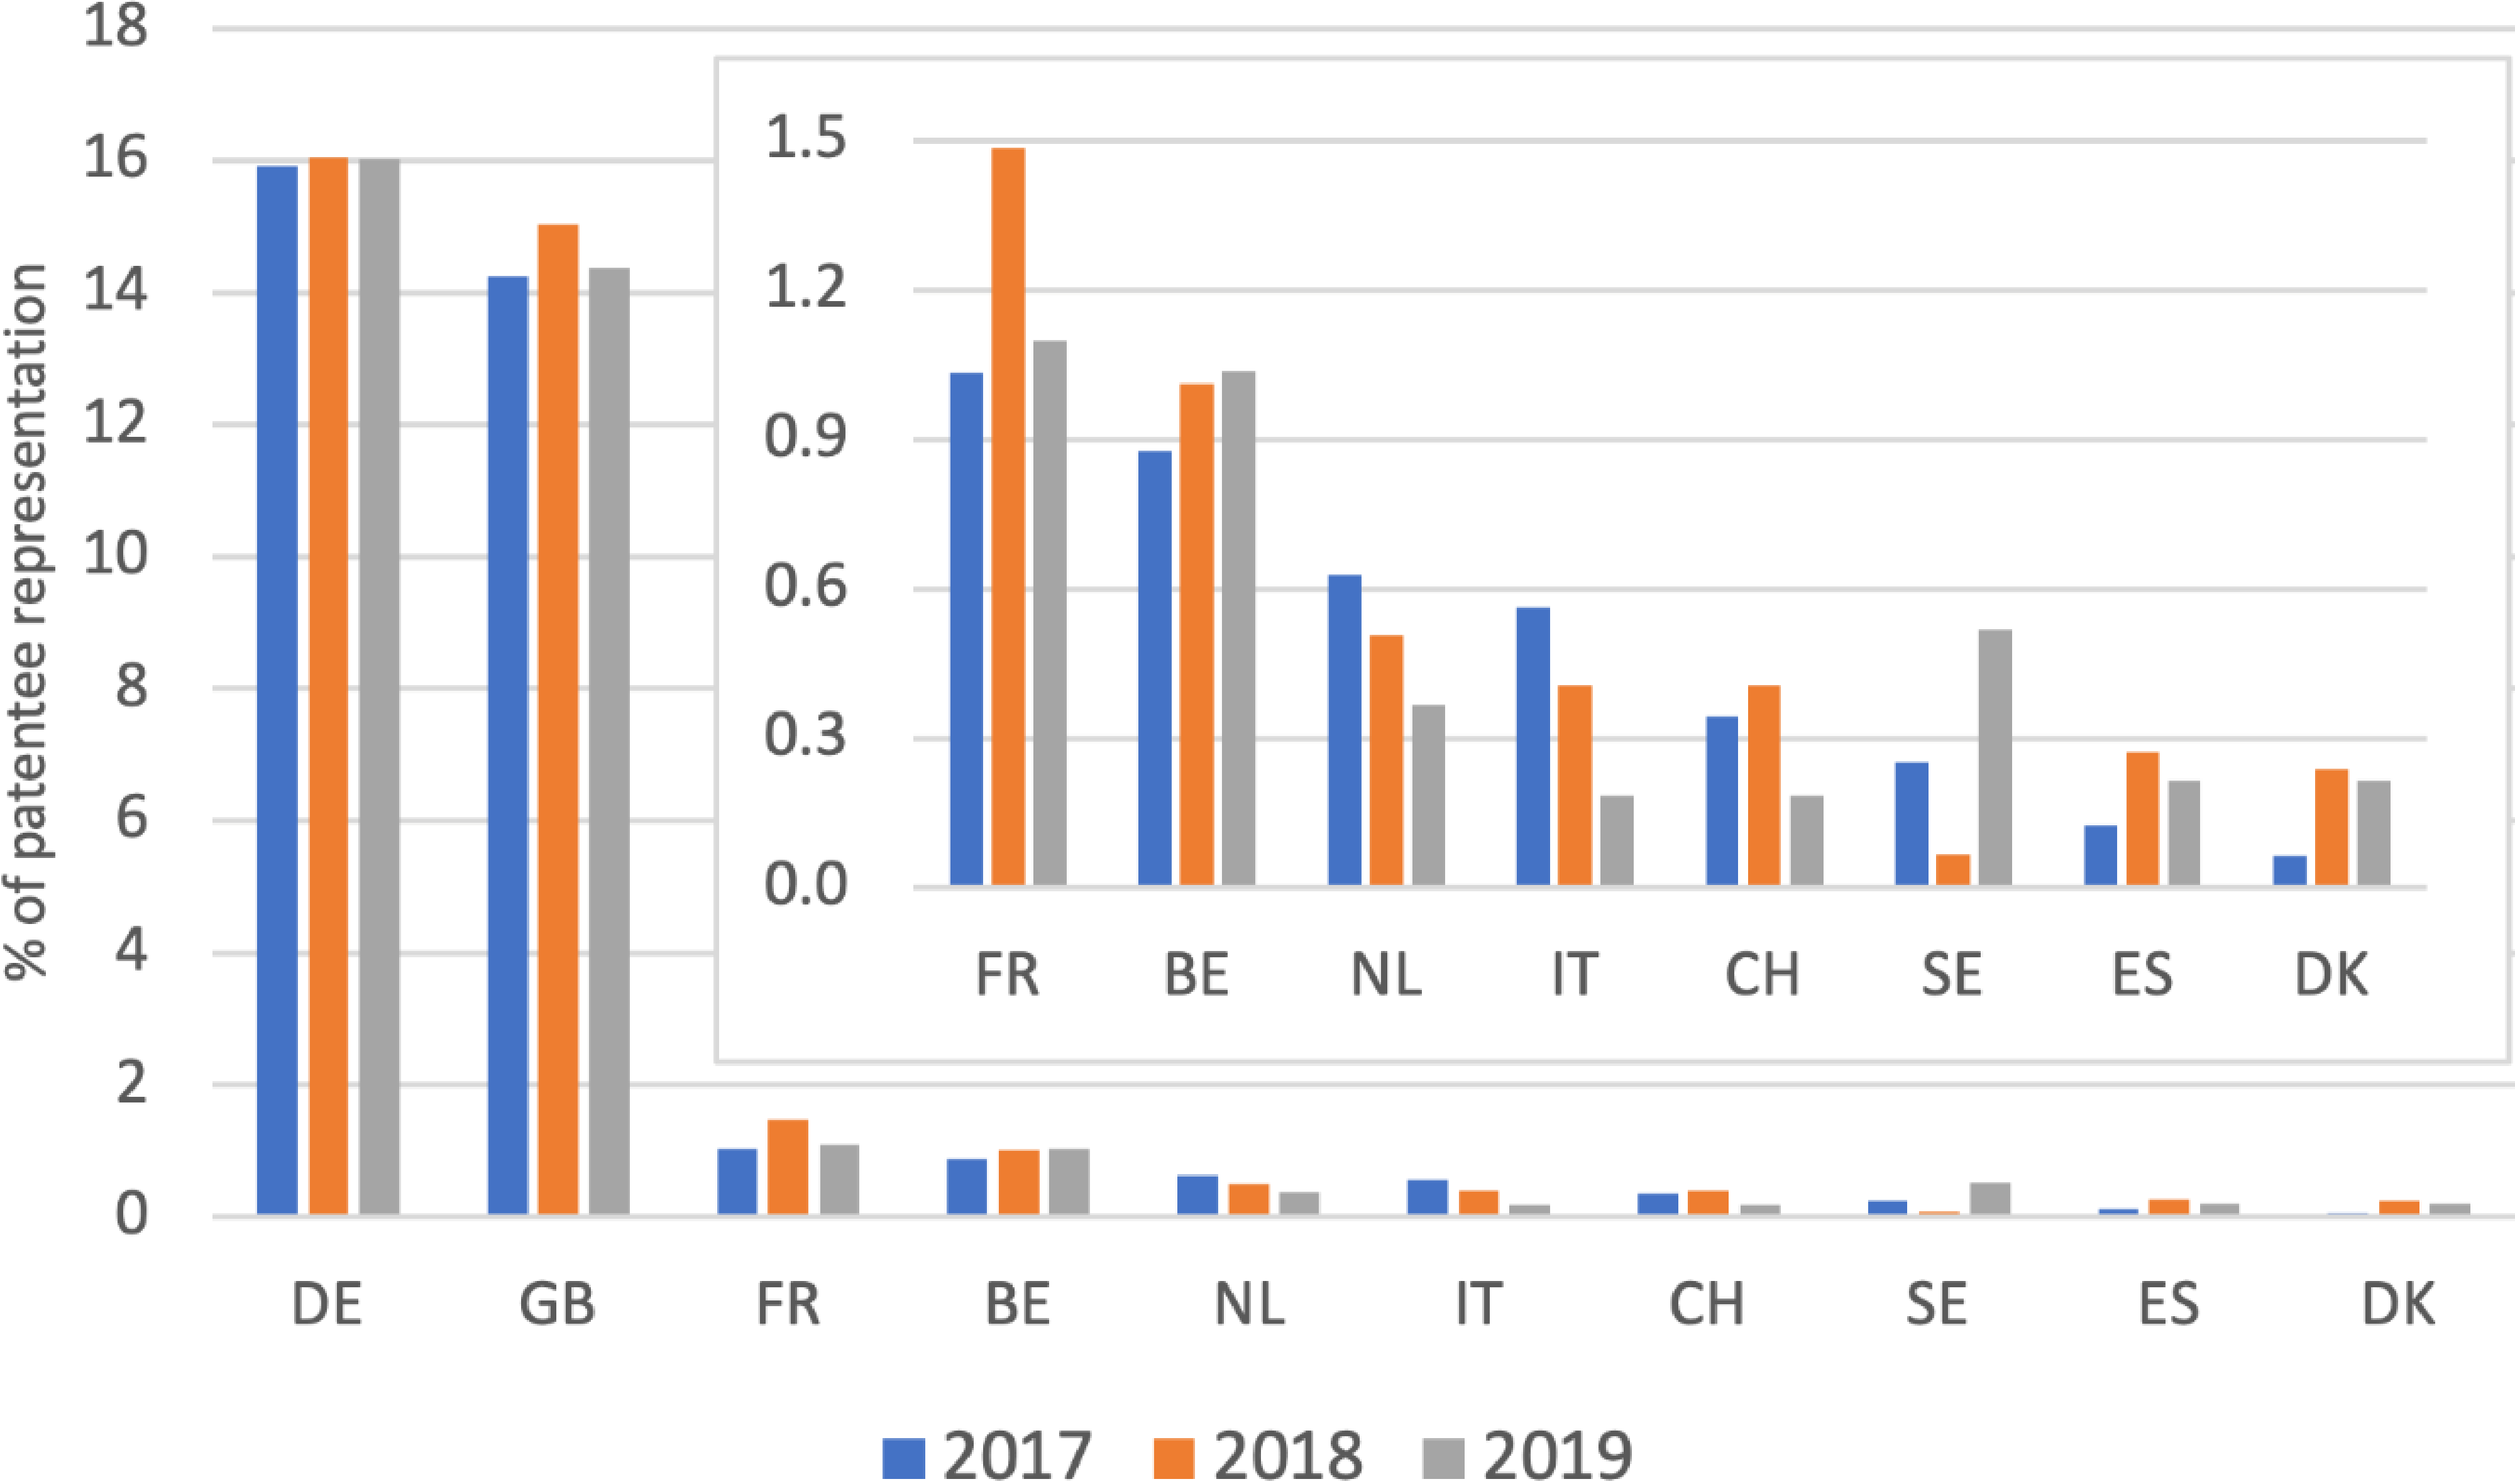
Figure 2 Top 10 patentee nationalities (non-EPC contracting states) in EPO opposition during the 2017-2019 period.
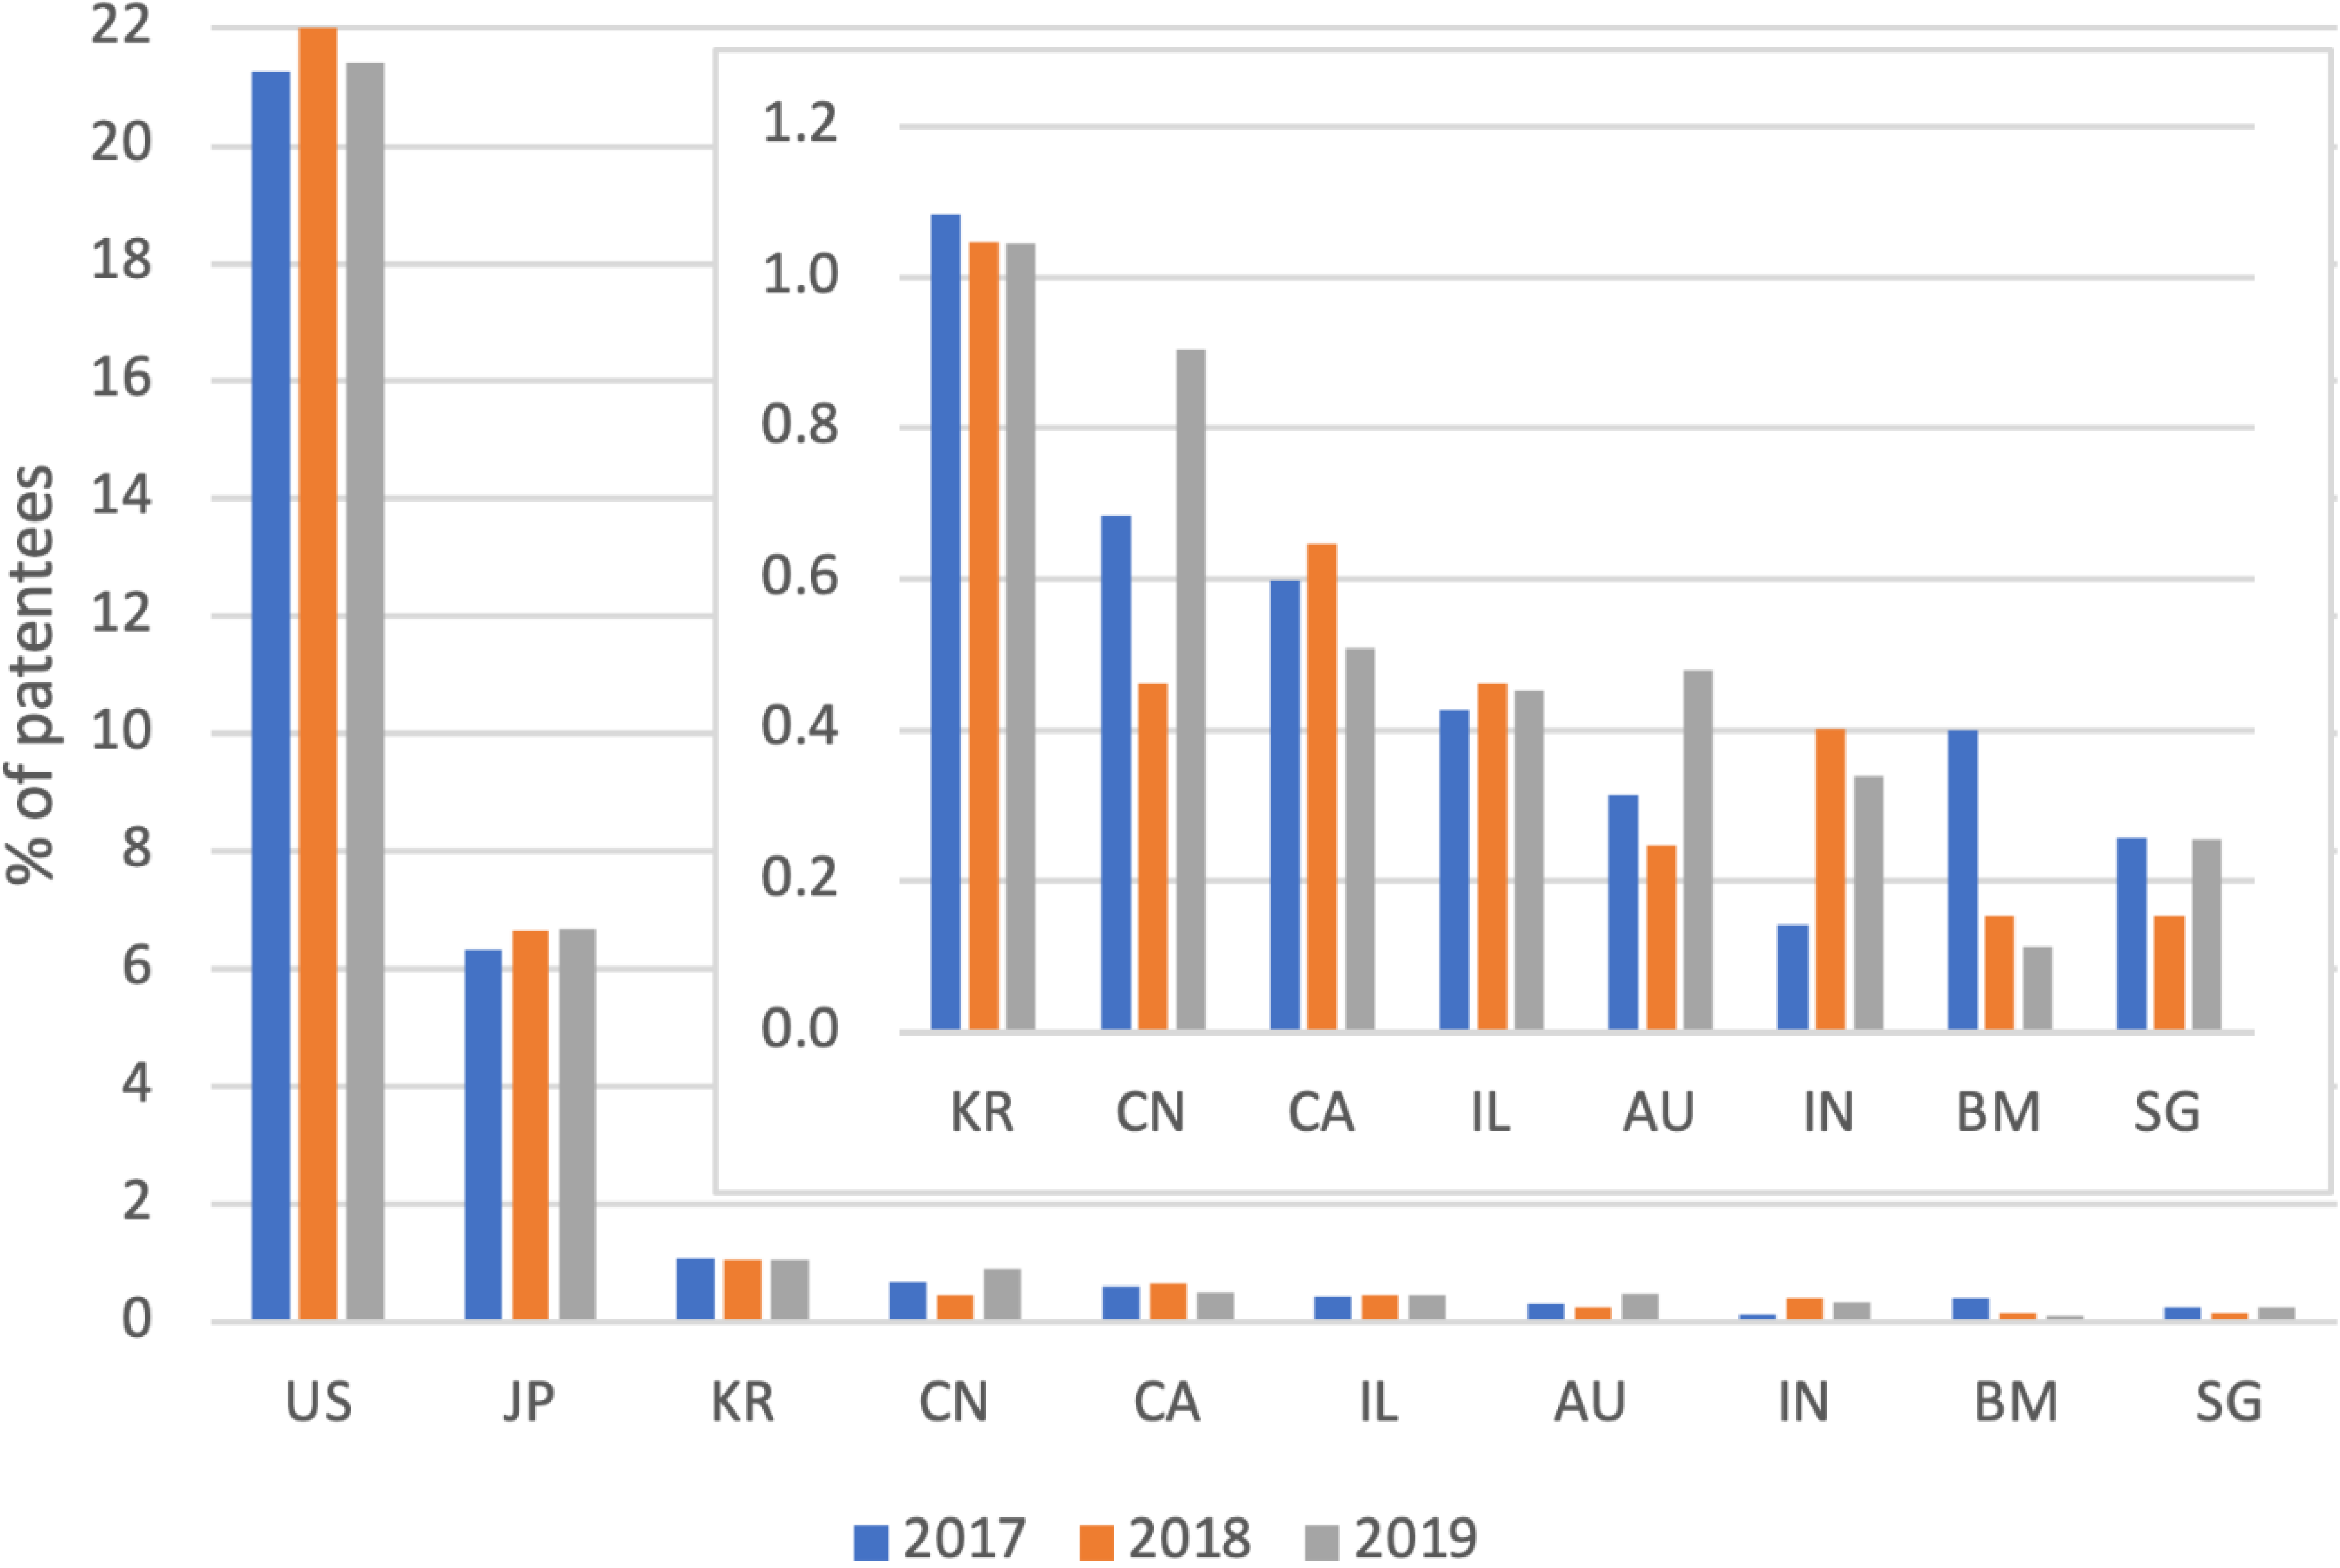
Overall, Germany appears as the country with the highest number of patentees against which an opposition is filed, for all analysed years, although it shows a downward trend from 31 % of the patentees in 2017 to 27% in 2019. For the EPC states, Germany is followed by Switzerland, which also presents a downward trend from 7.4% to 6.6%, while France is third, in this case with an upward trend from 6.5 % to 7.6 % of the patentees. The top five is completed by the Netherlands, with about 5% of the patentees, and the UK, which goes up from 3.9 % in 2017 to 4.7 % in 2019. Looking at non-EPC countries, the US is clearly dominant in percentage of patentees, with the second overall position right after Germany and with steady percentages around 21% to 22%. The US is followed by Japan, which comes in fifth overall and appears to be slightly increasing from 6.3 % in 2017 to 6.7 % in 2019. The top five of non-EPC state patentees is completed by Korea (steady around 1 %), China (increasing from 0.7% in 2017 to 0.9% in 2019) and Canada (decreasing from 0.6% in 2017 to 0.5% in 2019).
The surprising appearance of Bermuda in the non-EPC top 10 is mainly due to the companies Boston Scientific and AbbVie, which have their patent-holding entity in Bermuda, but the number of patentees from this country is dropping rapidly from 0.4 % in 2017 to only 0.1 % in 2019. Also noteworthy is the marked increase in Australian patentees in EPO opposition from 0.3 % in 2017 to 0.5 % in 2019.
PATENTEE REPRESENTATIVES
Next, we set out to analyse the nationalities of the firms representing patentees in opposition procedures before the EPO. Figure 3 represents the top nationalities of these representatives during the 2017-2019 period. Figures 4 to 6 dive a bit deeper into the matter and classify the representative nationality based on the different patentee nationalities, in particular showing which are the top representative nationalities representing patentees of the same nationality (Figure 4), the top representative nationalities representing patentees having a different EPC nationality (Figure 5) and the top representative nationalities representing patentees having a different, non-EPC nationality (Figure 6).
Figure 3 Top 10 nationalities of patentee representatives in EPO opposition proceedings during the 2017-2019 period.
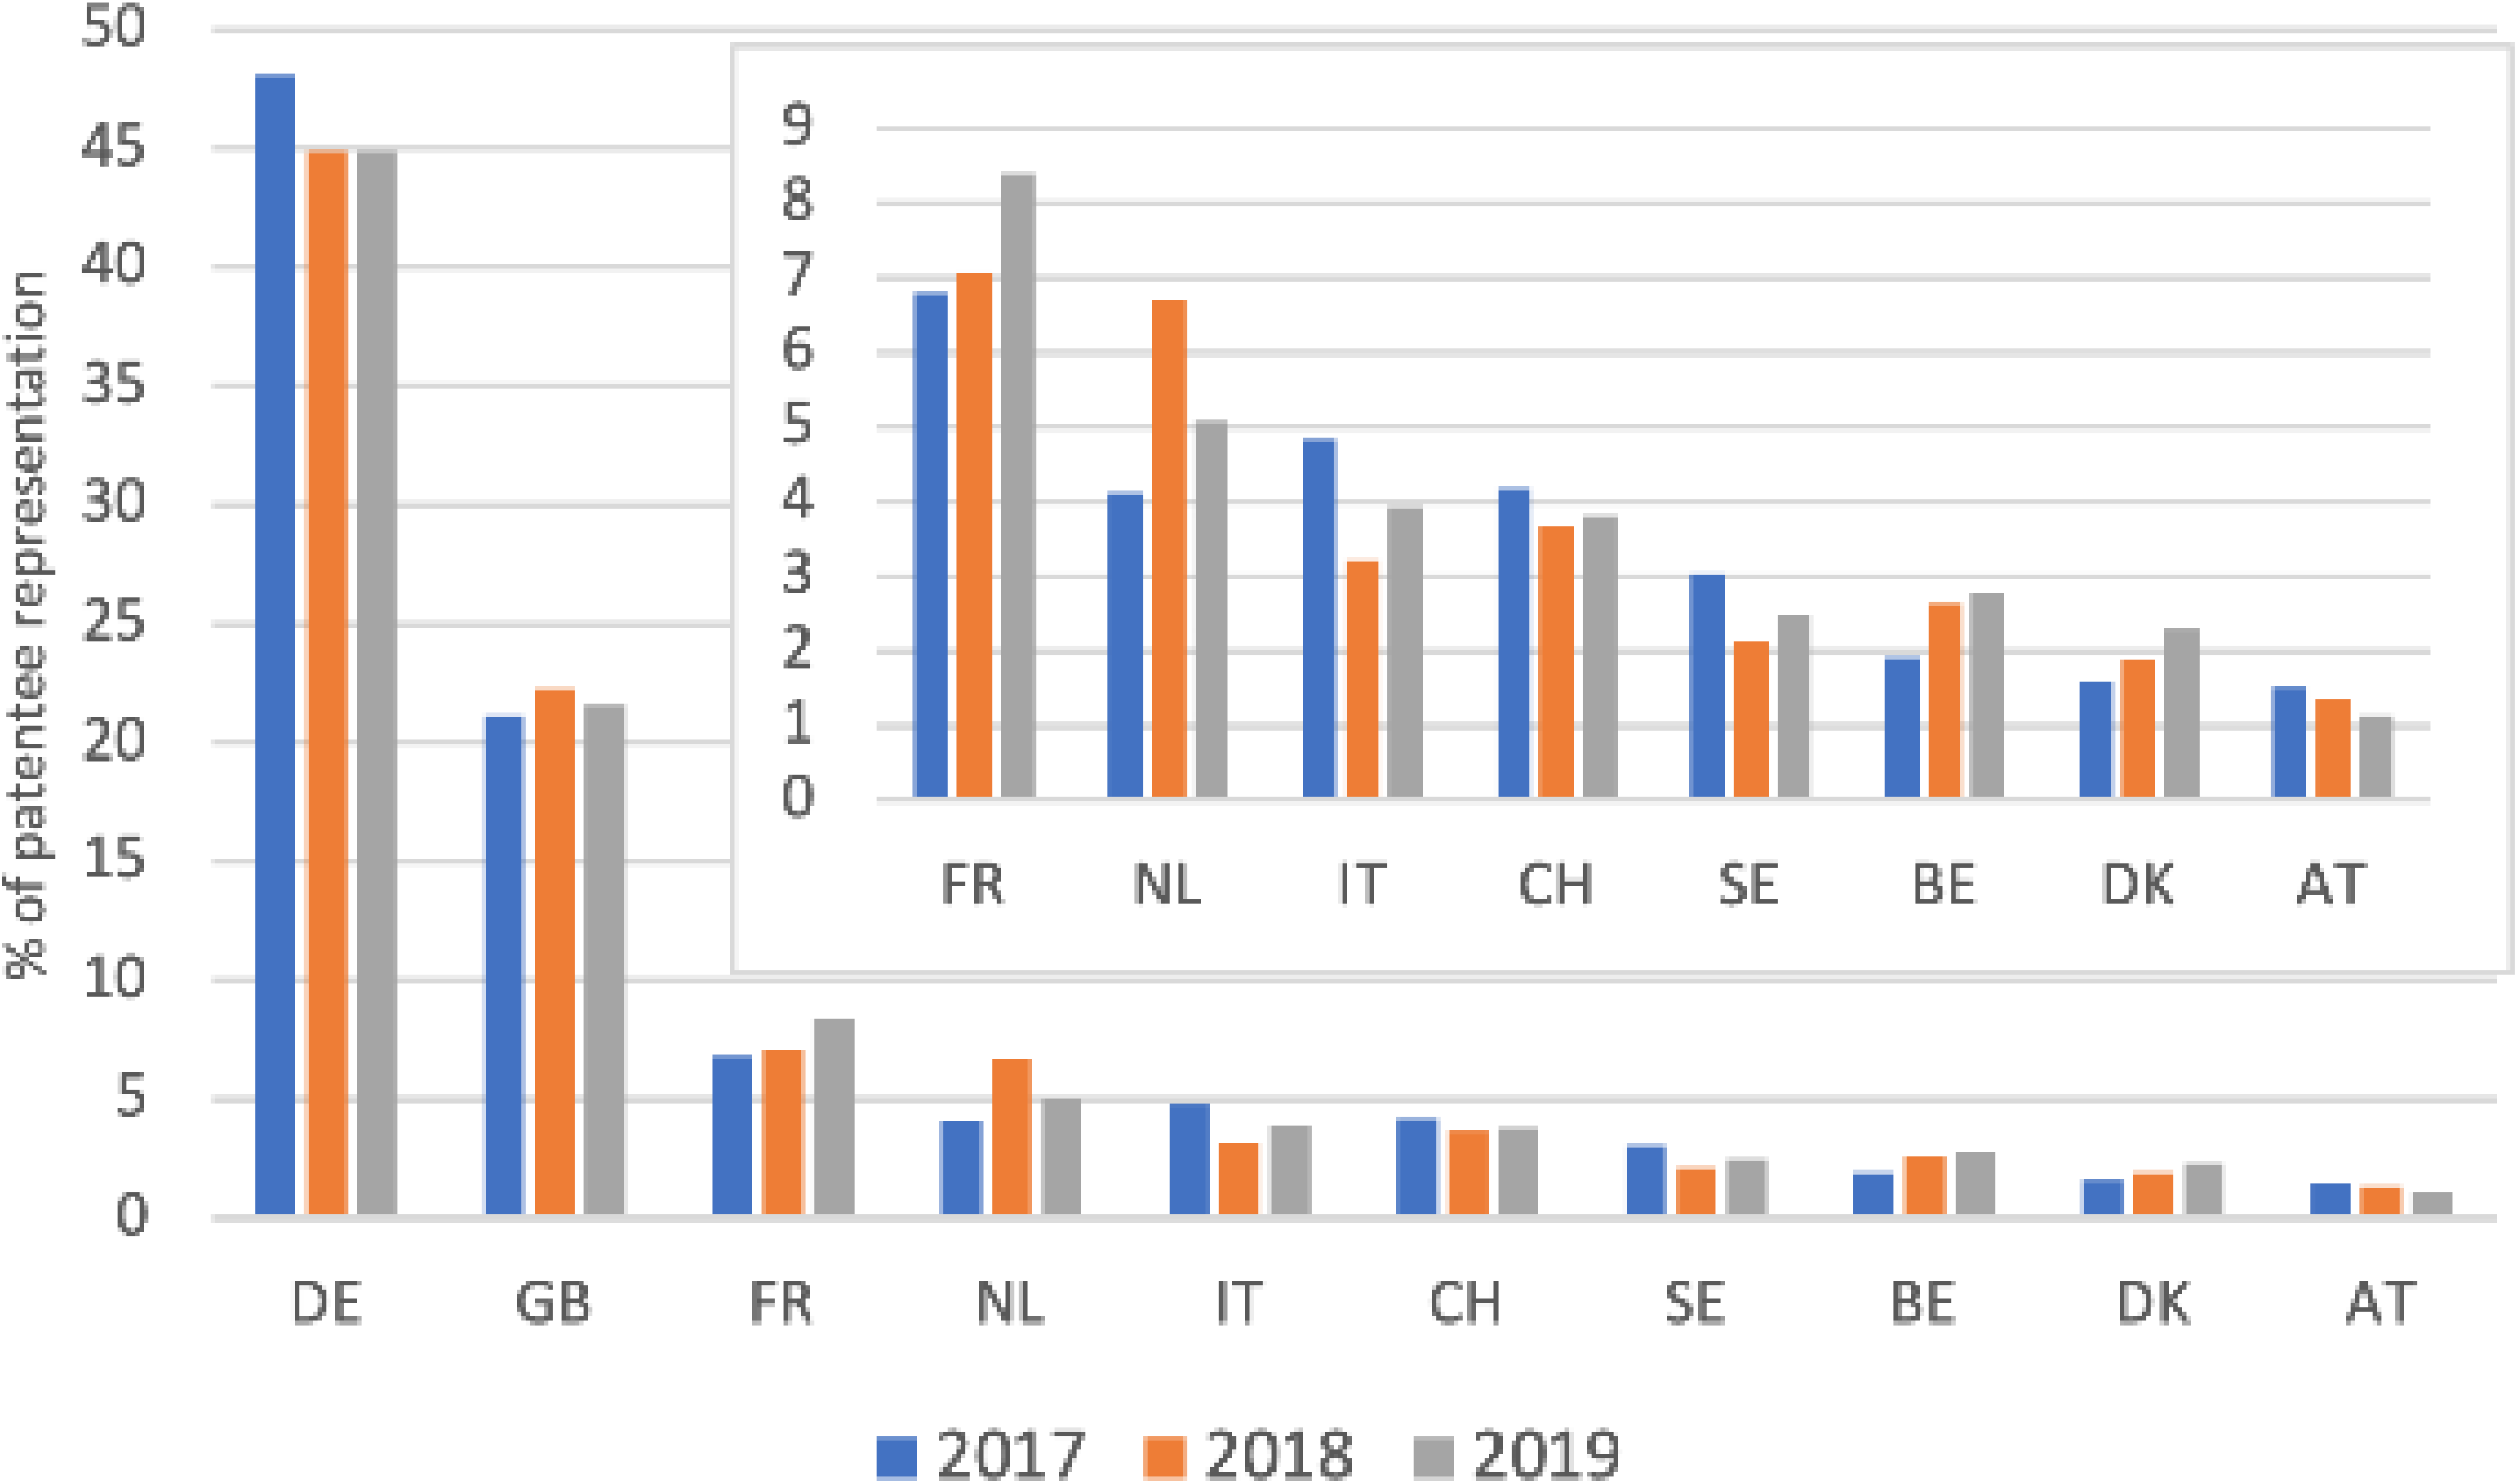
Figure 4 Top 10 nationalities of patentee representatives of the same nationality than the patentee.
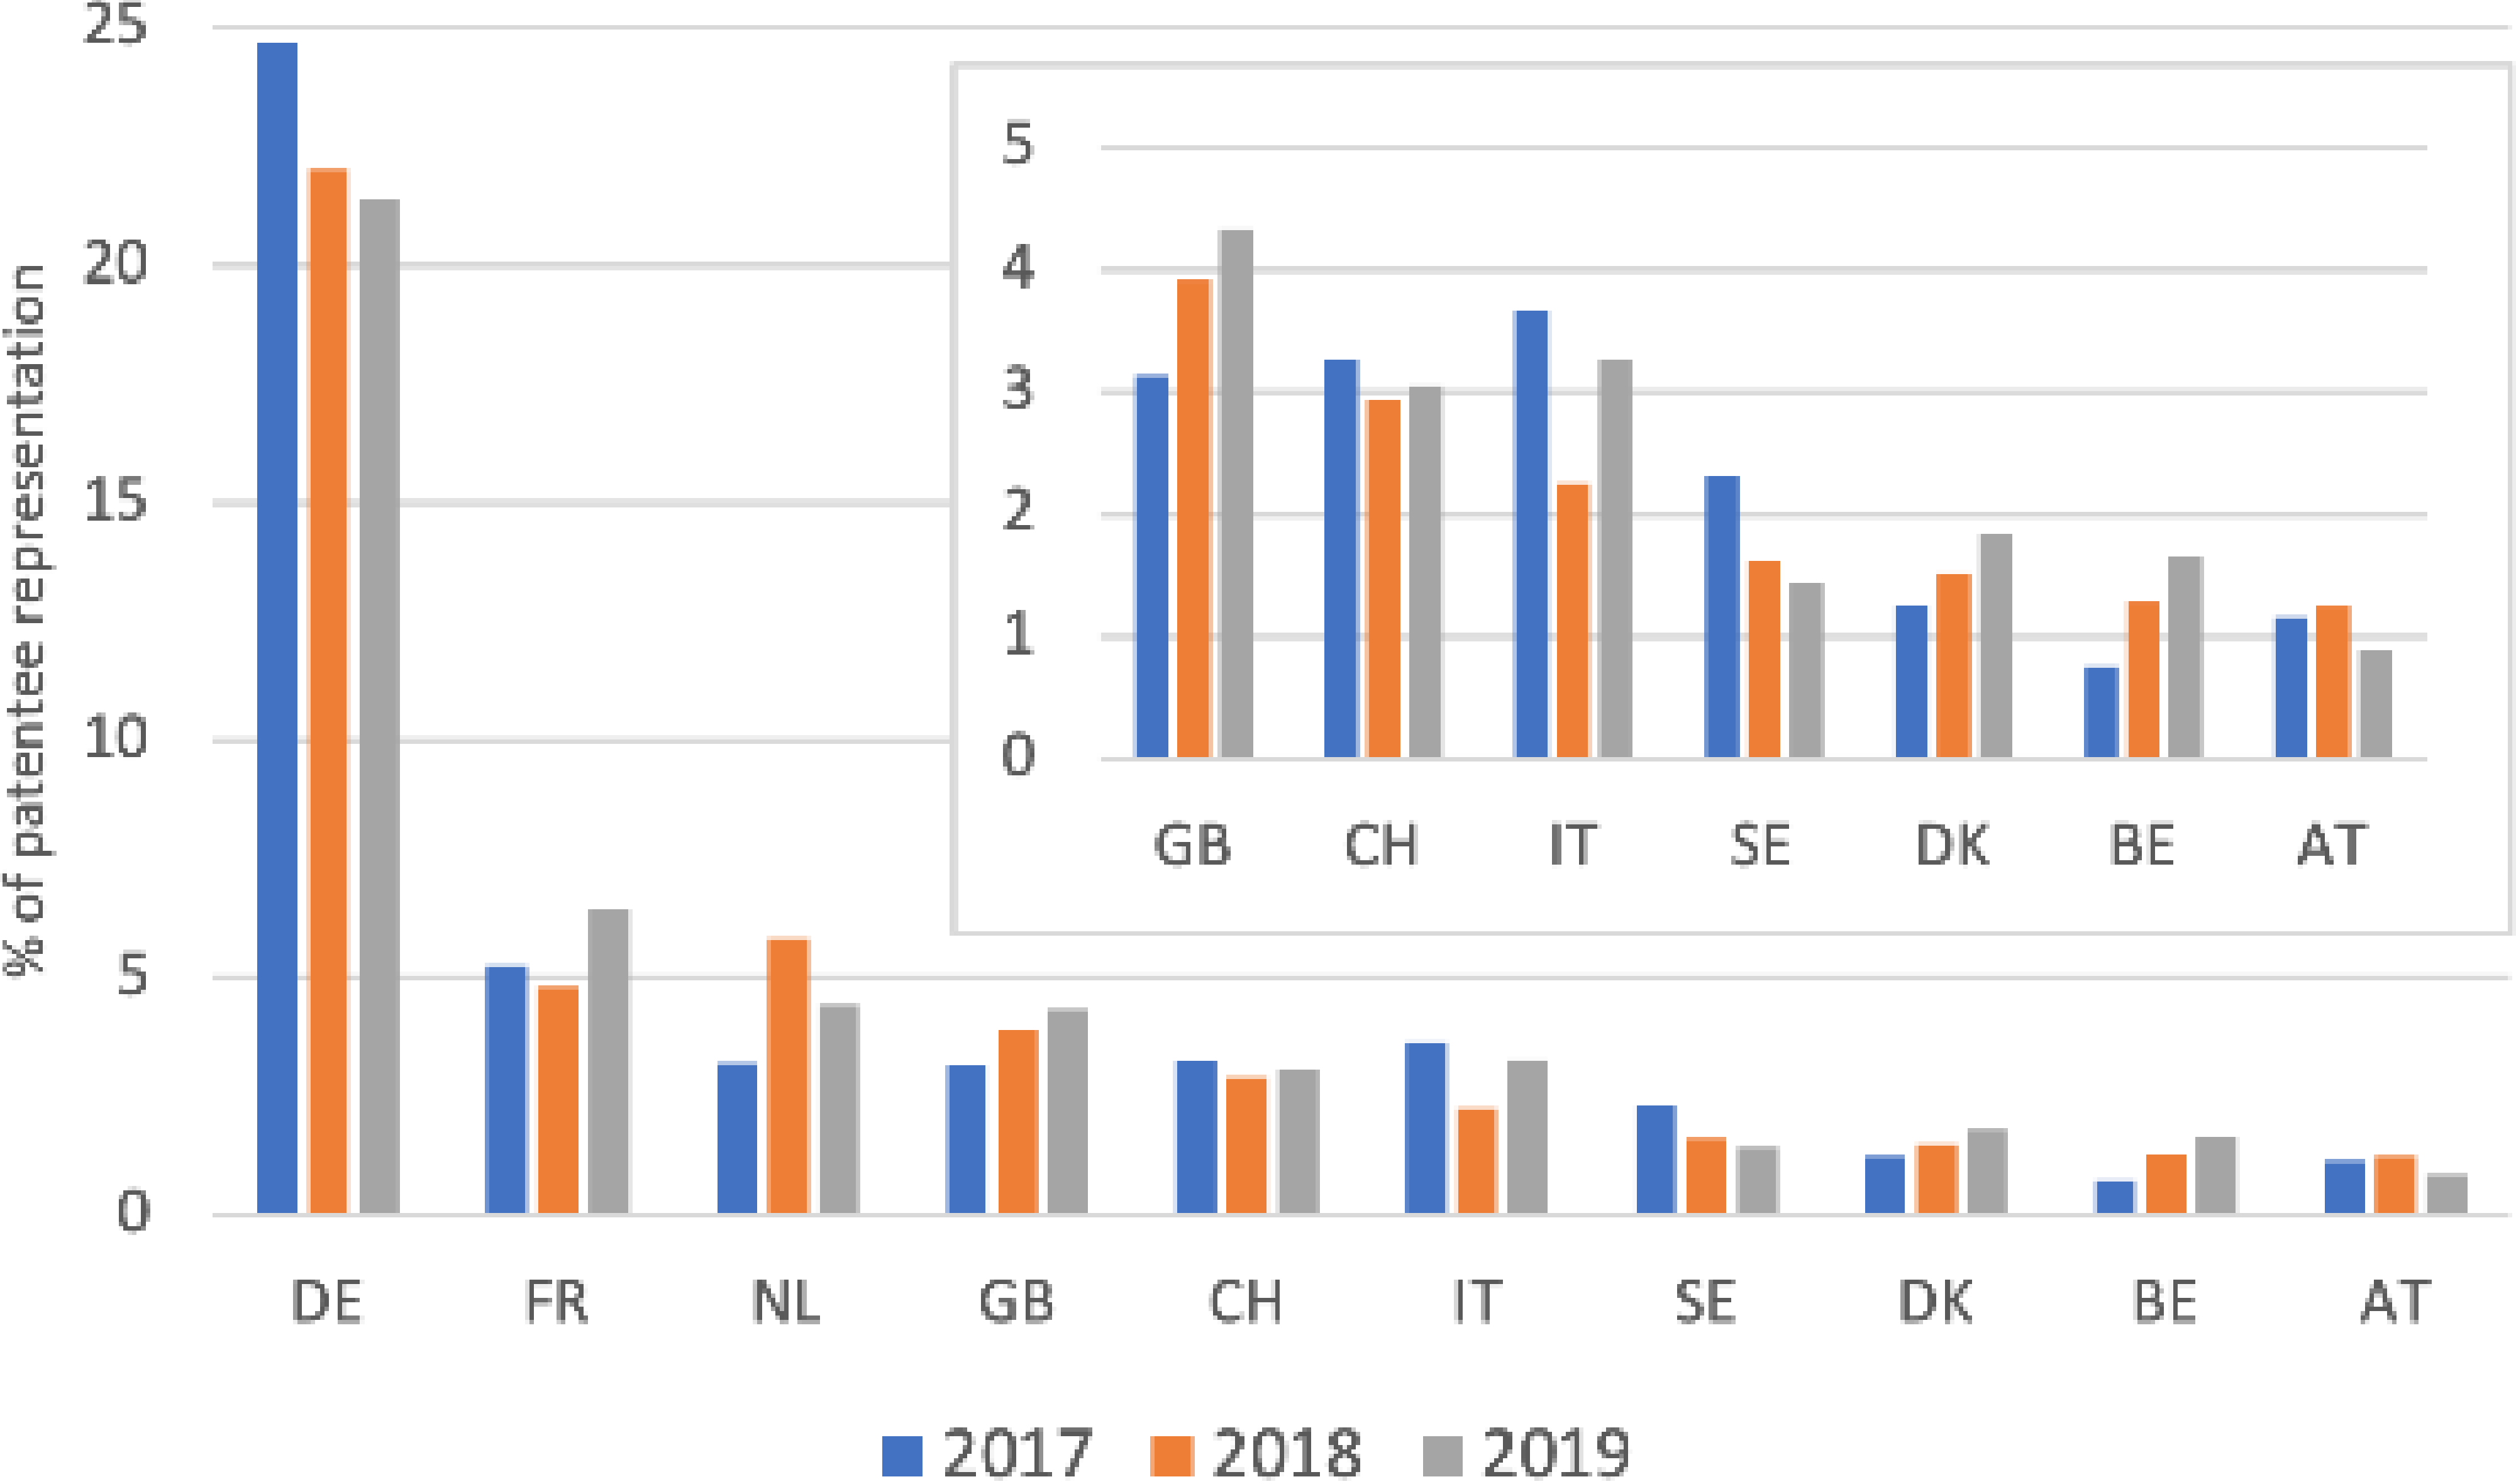
Figure 5 Top 10 nationalities of patentee representatives of a different EPC country than the patentee.
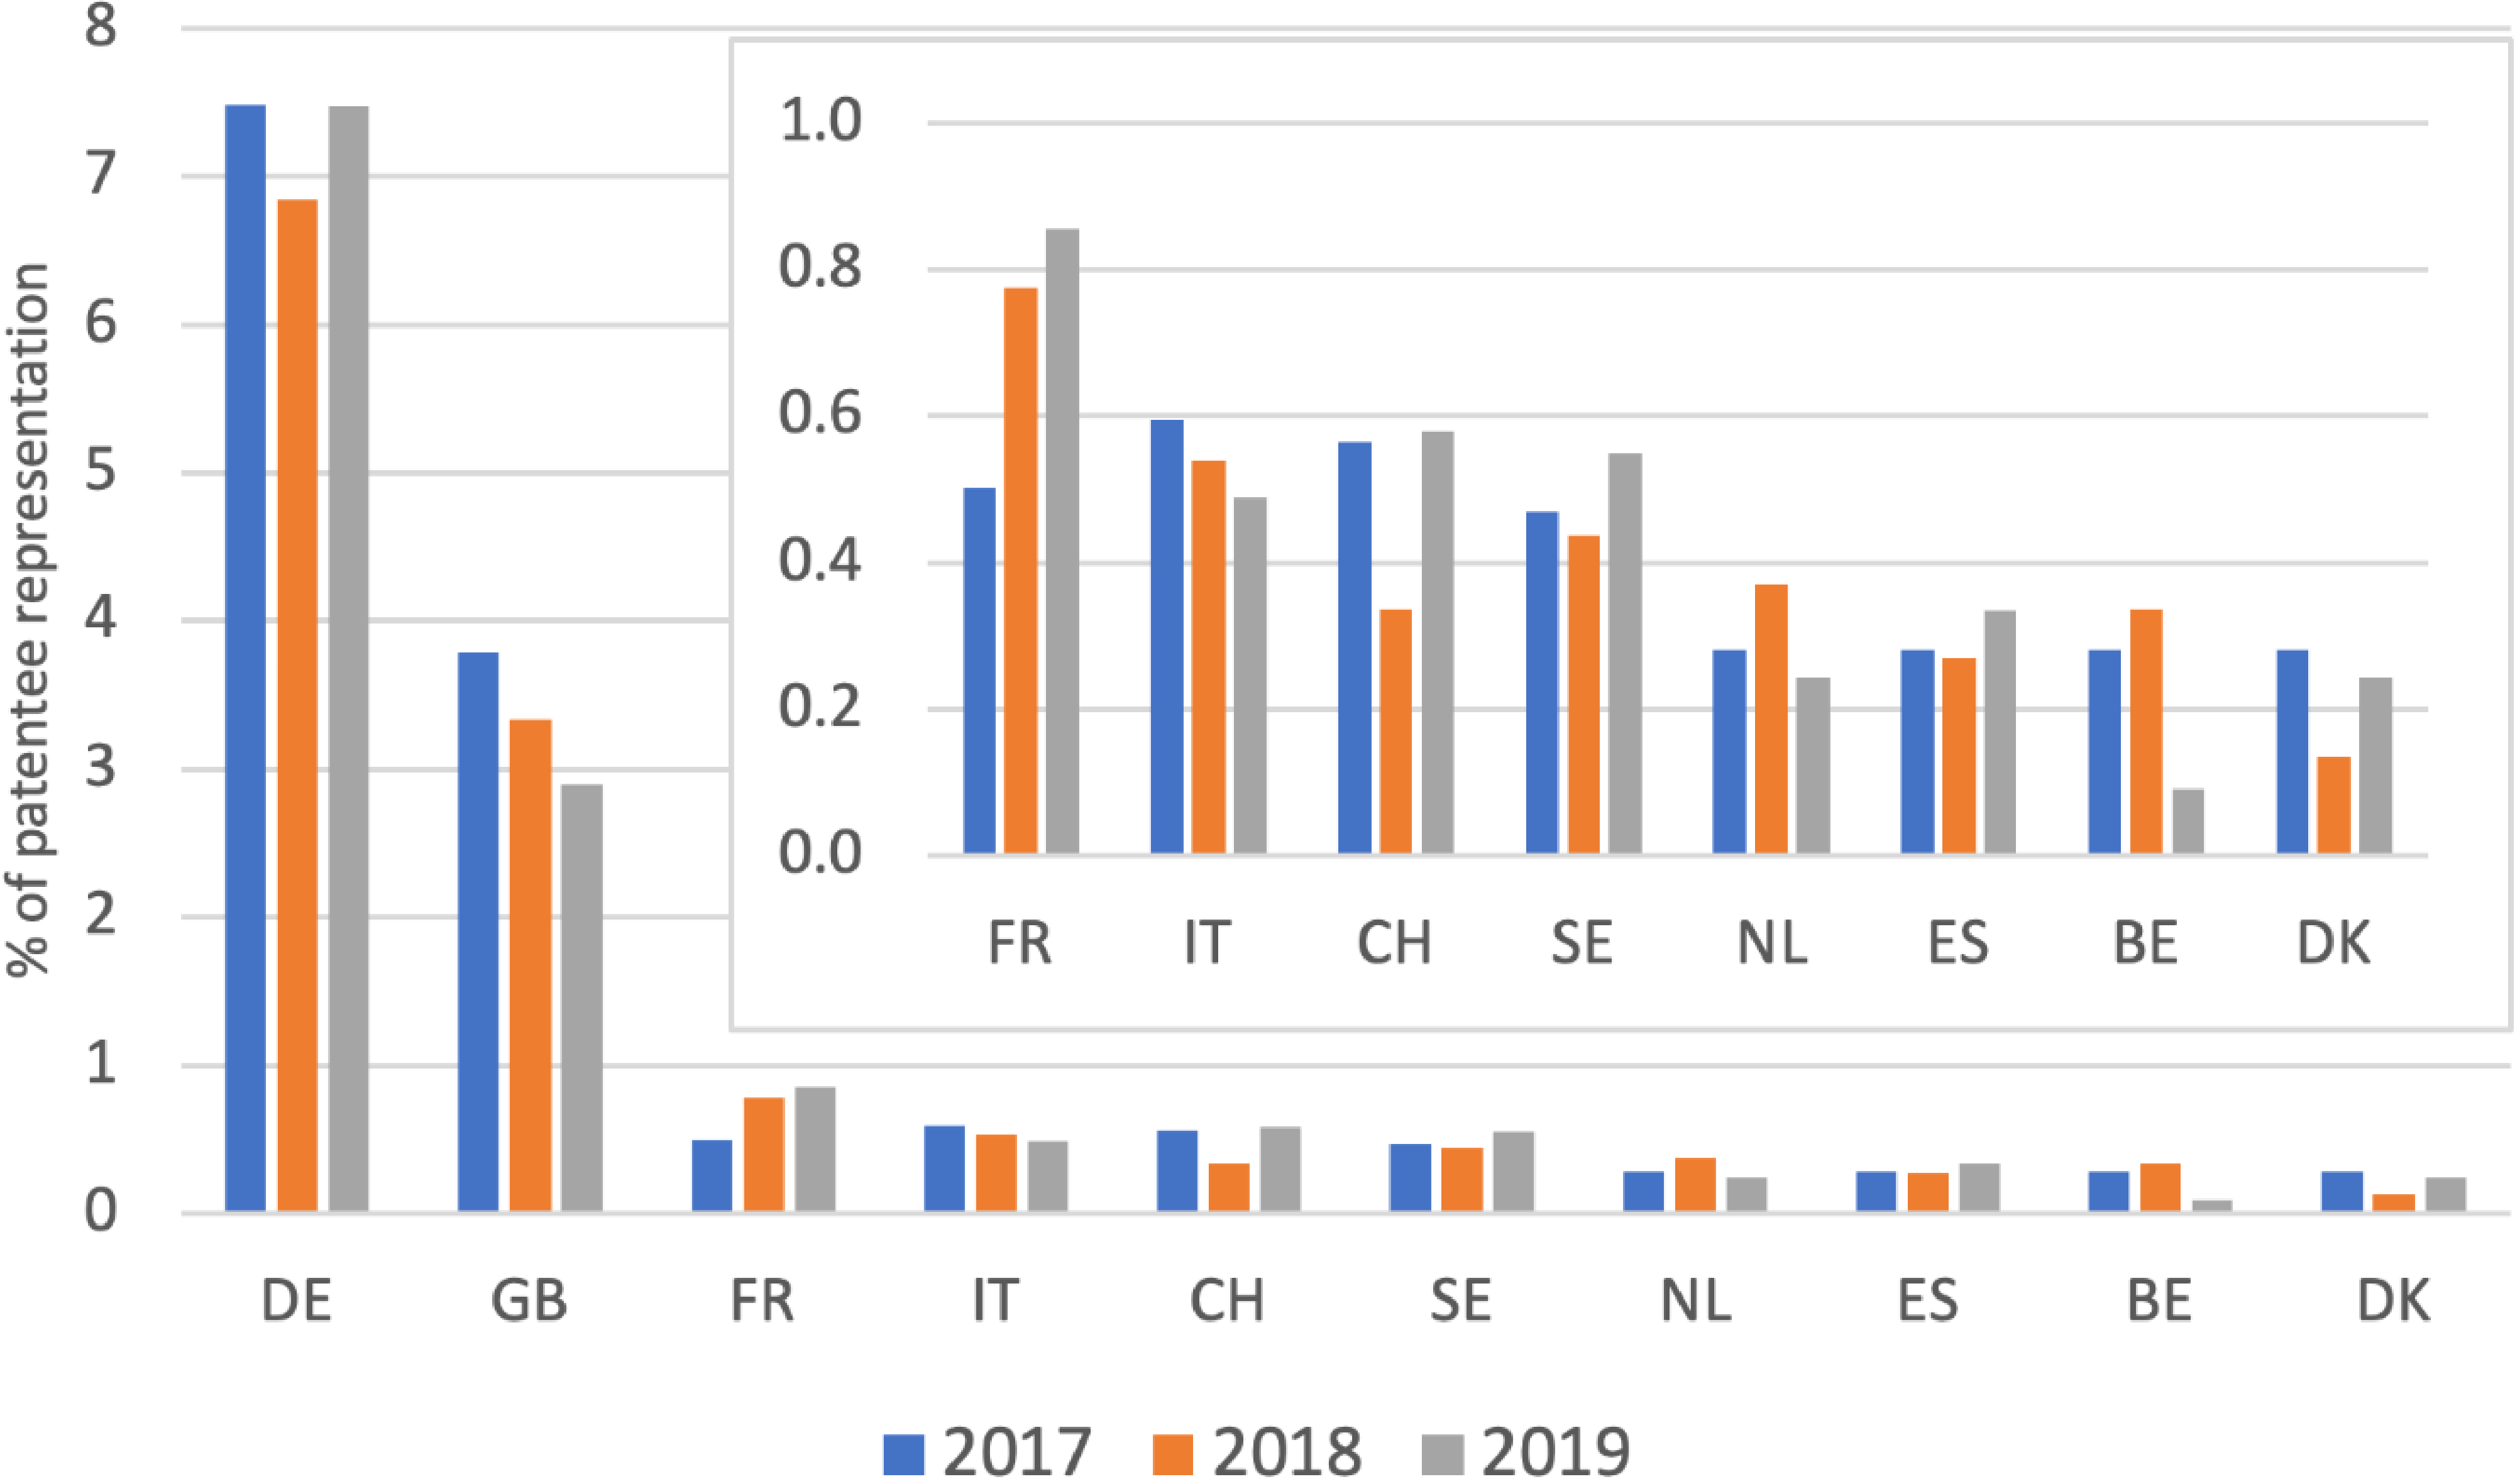
Figure 6 Top 10 nationalities of representatives of patentees from non-EPC countries in EPO Opposition during the 2017-2019 period.
Germany is by far the top country in terms of patentee representation. However, its percentage decreased from 48.1% in 2017 to 44.9% in 2019. This is mainly due to a decrease in the number of German patentees represented by German representatives (Figure 4), which is itself related to the decrease in percentage of German patentees (see above, Figure 1).
The representation of patentees from other EPC or from non-EPC countries by German patentees remained stable through the 2017-2019 period, where German representatives top both charts with values around 7% (Figure 5) and 16% (Figure 6) of the total oppositions, respectively.
The UK is the second country in terms of patentee representatives and appears to be stable at around 21.5% throughout the 2017-2019 period (Figure 3). However, this turns out to be the sum of two changing variables: the percentage of UK representation of UK patentees increases from 3.1% in 2017 to 4.3% in 2019, but UK representation of patentees from other EPC countries decreased from 3.8% to 2.9% in the same period. This could be a consequence the Brexit scenario, with more UK patentees seeking local representation while patentees from other EPC member states have a decreasing interest in seeking representation in UK representatives. That said, most of the patentees that choose representation from the UK in EPO opposition proceedings come from non-EPC countries and steadily account for around 14.5% of the patentees in the 2017-2019 period.
When looking for foreign representation, both EPC (Figure 5) and non-EPC (Figure 6) countries mainly choose German or UK representatives. However, while their values for non-EPC countries are comparable (16% v 14.4% in 2019), EPC countries have a far greater preference for German representatives (7.5% vs. 2.9% in 2019).
The overall top 5 of patentee representative nationalities is completed by representatives of France (third), the Netherlands (fourth) and Italy (fifth). Among those, France presents an overall increasing trend from 6.8% of the patentee representation in 2017 to 8.4% in 2019 (Figure 3). This could be attributed to an increase in representation of both French and other EPC patentees (Figures 4 and 5), while its non-EPC representation remained stable (Figure 6).
Among the countries completing the top 10, note that the percentage of Belgian representatives increased from 1.9% in 2017 to 2.8% in 2019 (Figure 3). This was caused by the increased number of local Belgian (Figure 4) and non-EPC representation (Figure 6), which helped overcome the loss in the percentage of patentees from EPC countries other than Belgium (Figure 5).
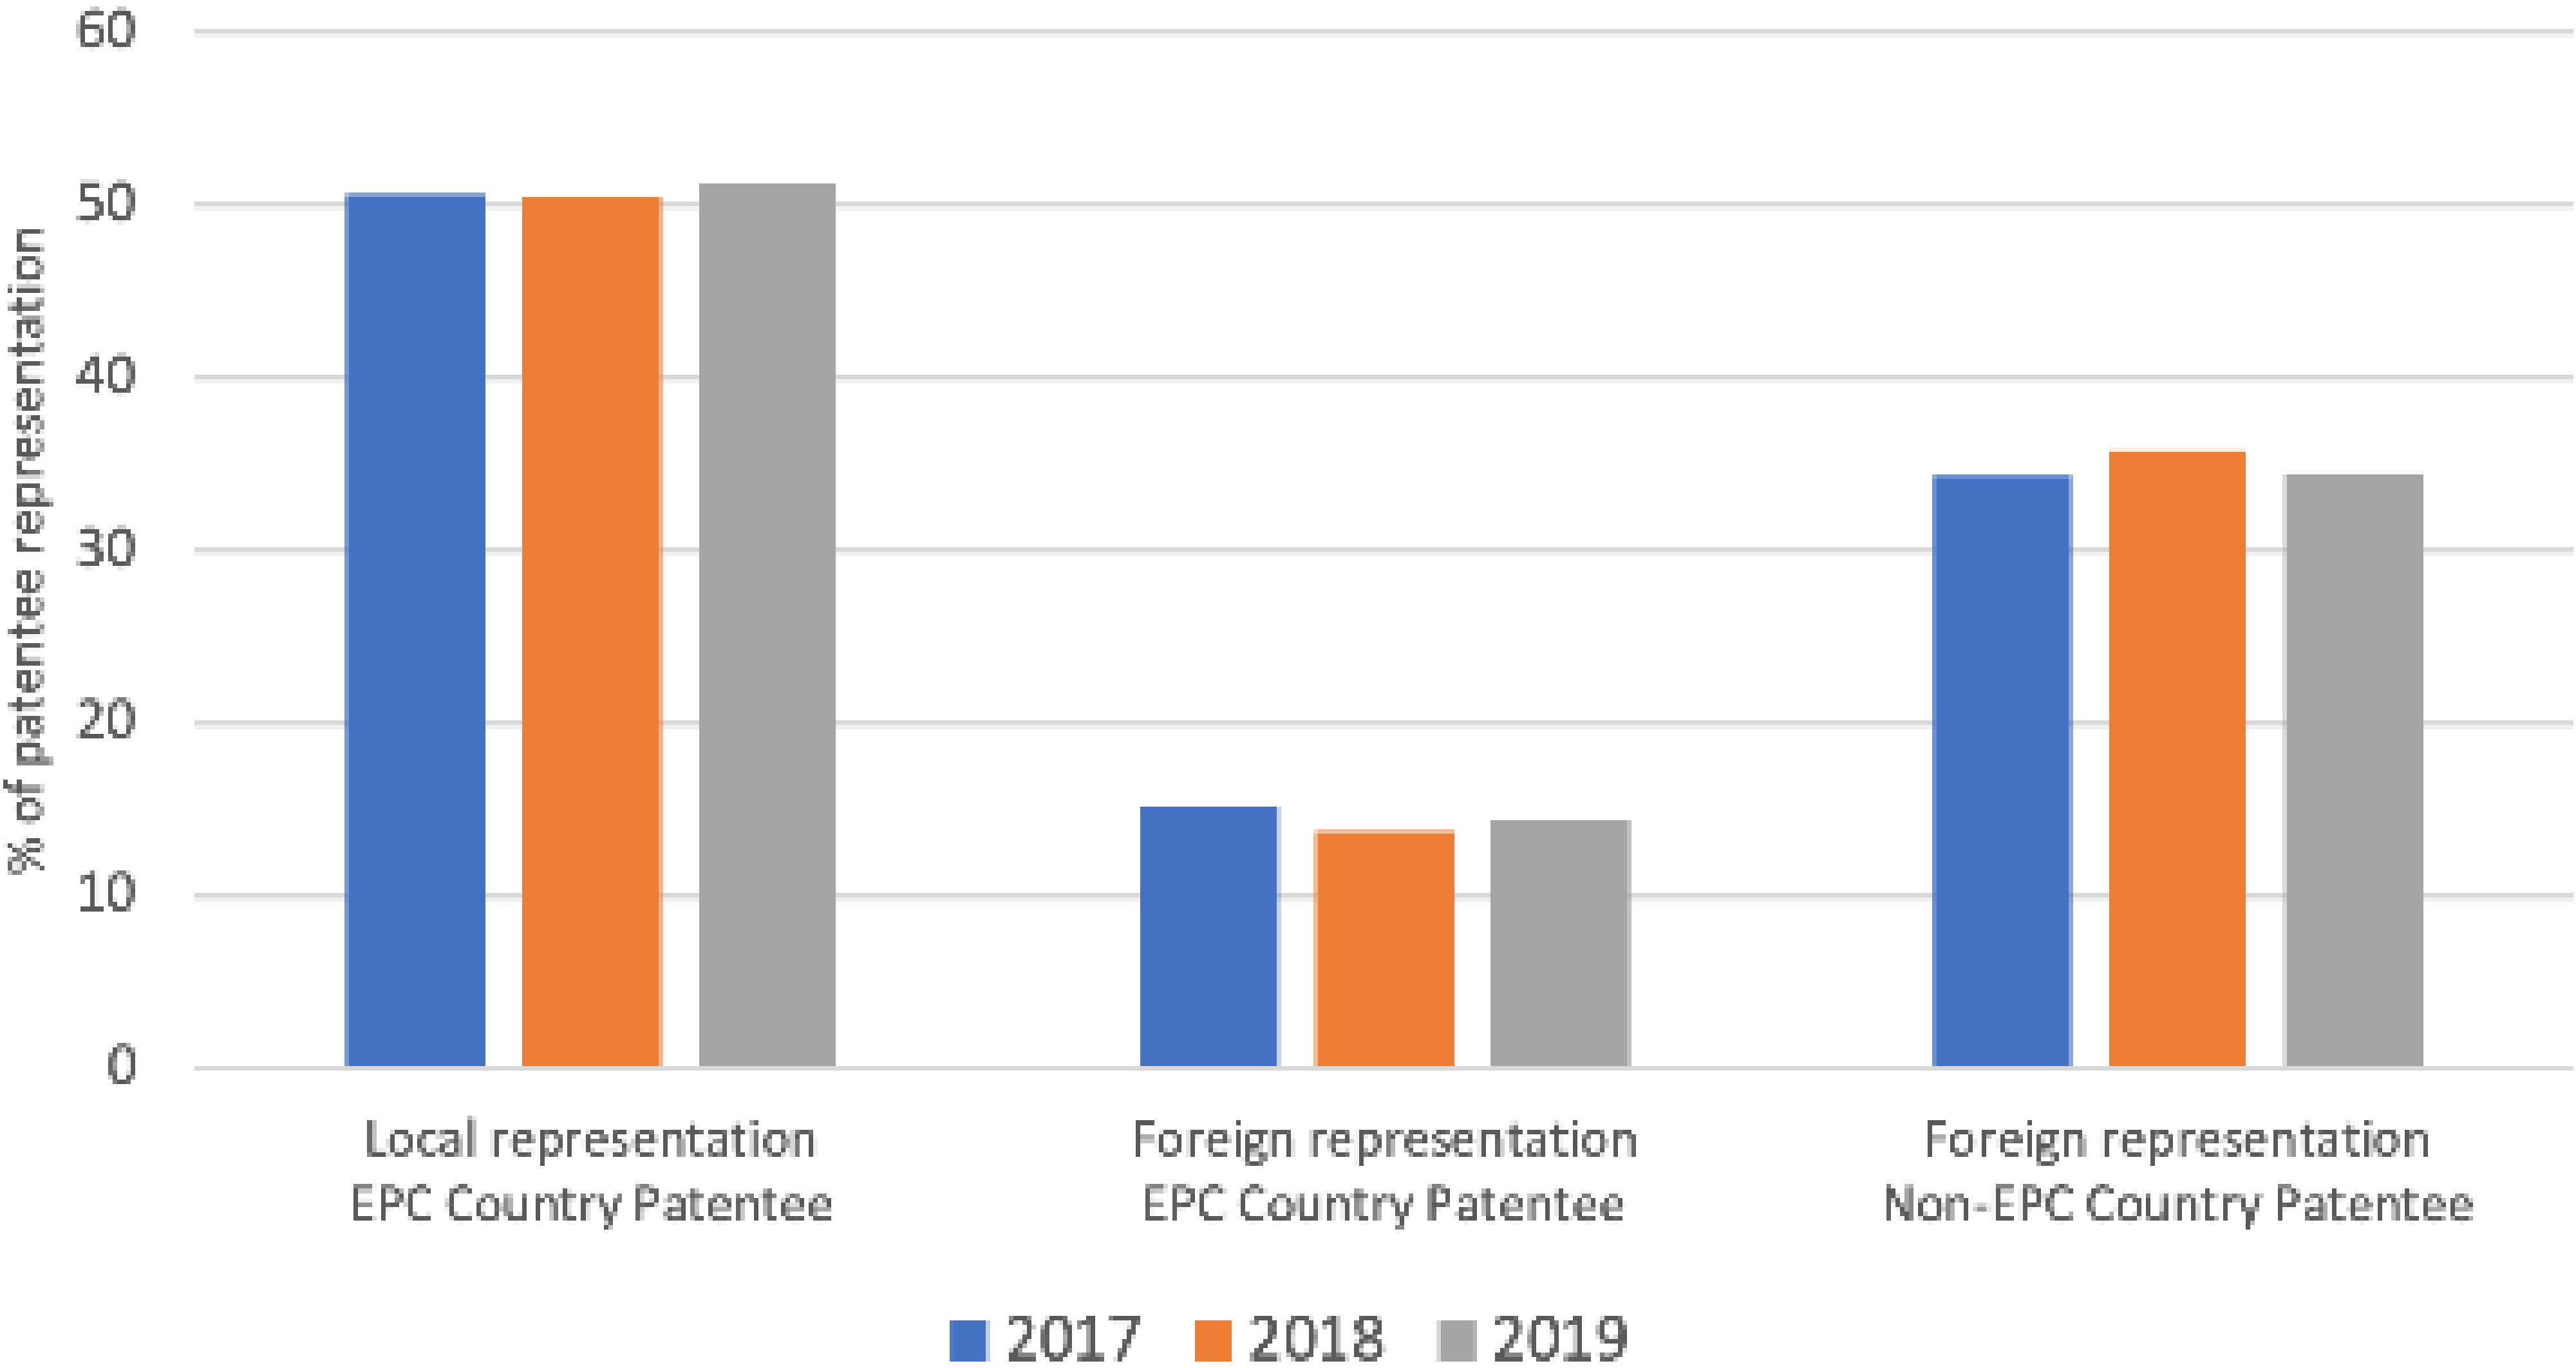
Most patentees from EPC countries opt for local representation – i.e., by a firm from the same country. As depicted in Figure 7, consistently over 50% of patentees in opposition procedures choose local representation from the same EPC country, while only about 15% of patentees are from a EPC country but choose a representative from another EPC country. The remaining 35% of opposition procedures have a patentee from a non-EPC country, which are necessarily represented by a firm from another country.
These values are more or less consistent over the 2017-2019 period, with a very slight increase in local representation for patentees from EPC states, at the expense of representation from another EPC country. Almost a quarter of patentees from an EPC country prefer to choose a representative from another EPC country to represent them in EPO opposition. This is indicative of a reasonable mobility between EPC countries when looking for patentee representation.
Figure 7 EPO Oppositions by nationality of patentees and representatives.
CHOICE OF REPRESENTATIVE BY US OR JAPANESE PATENTEES
The most abundant non-EPC countries that provide patentees in EPO opposition proceedings are the US and Japan. Like all non-EPC patentees, they are legally obliged to appoint a professional representative. We have analysed which representative nationalities are favoured by these countries to represent them in EPO opposition in more detail.
Figure 8 Choice of representative nationality by US patentees in EPO Opposition during the 2017-2019 period.
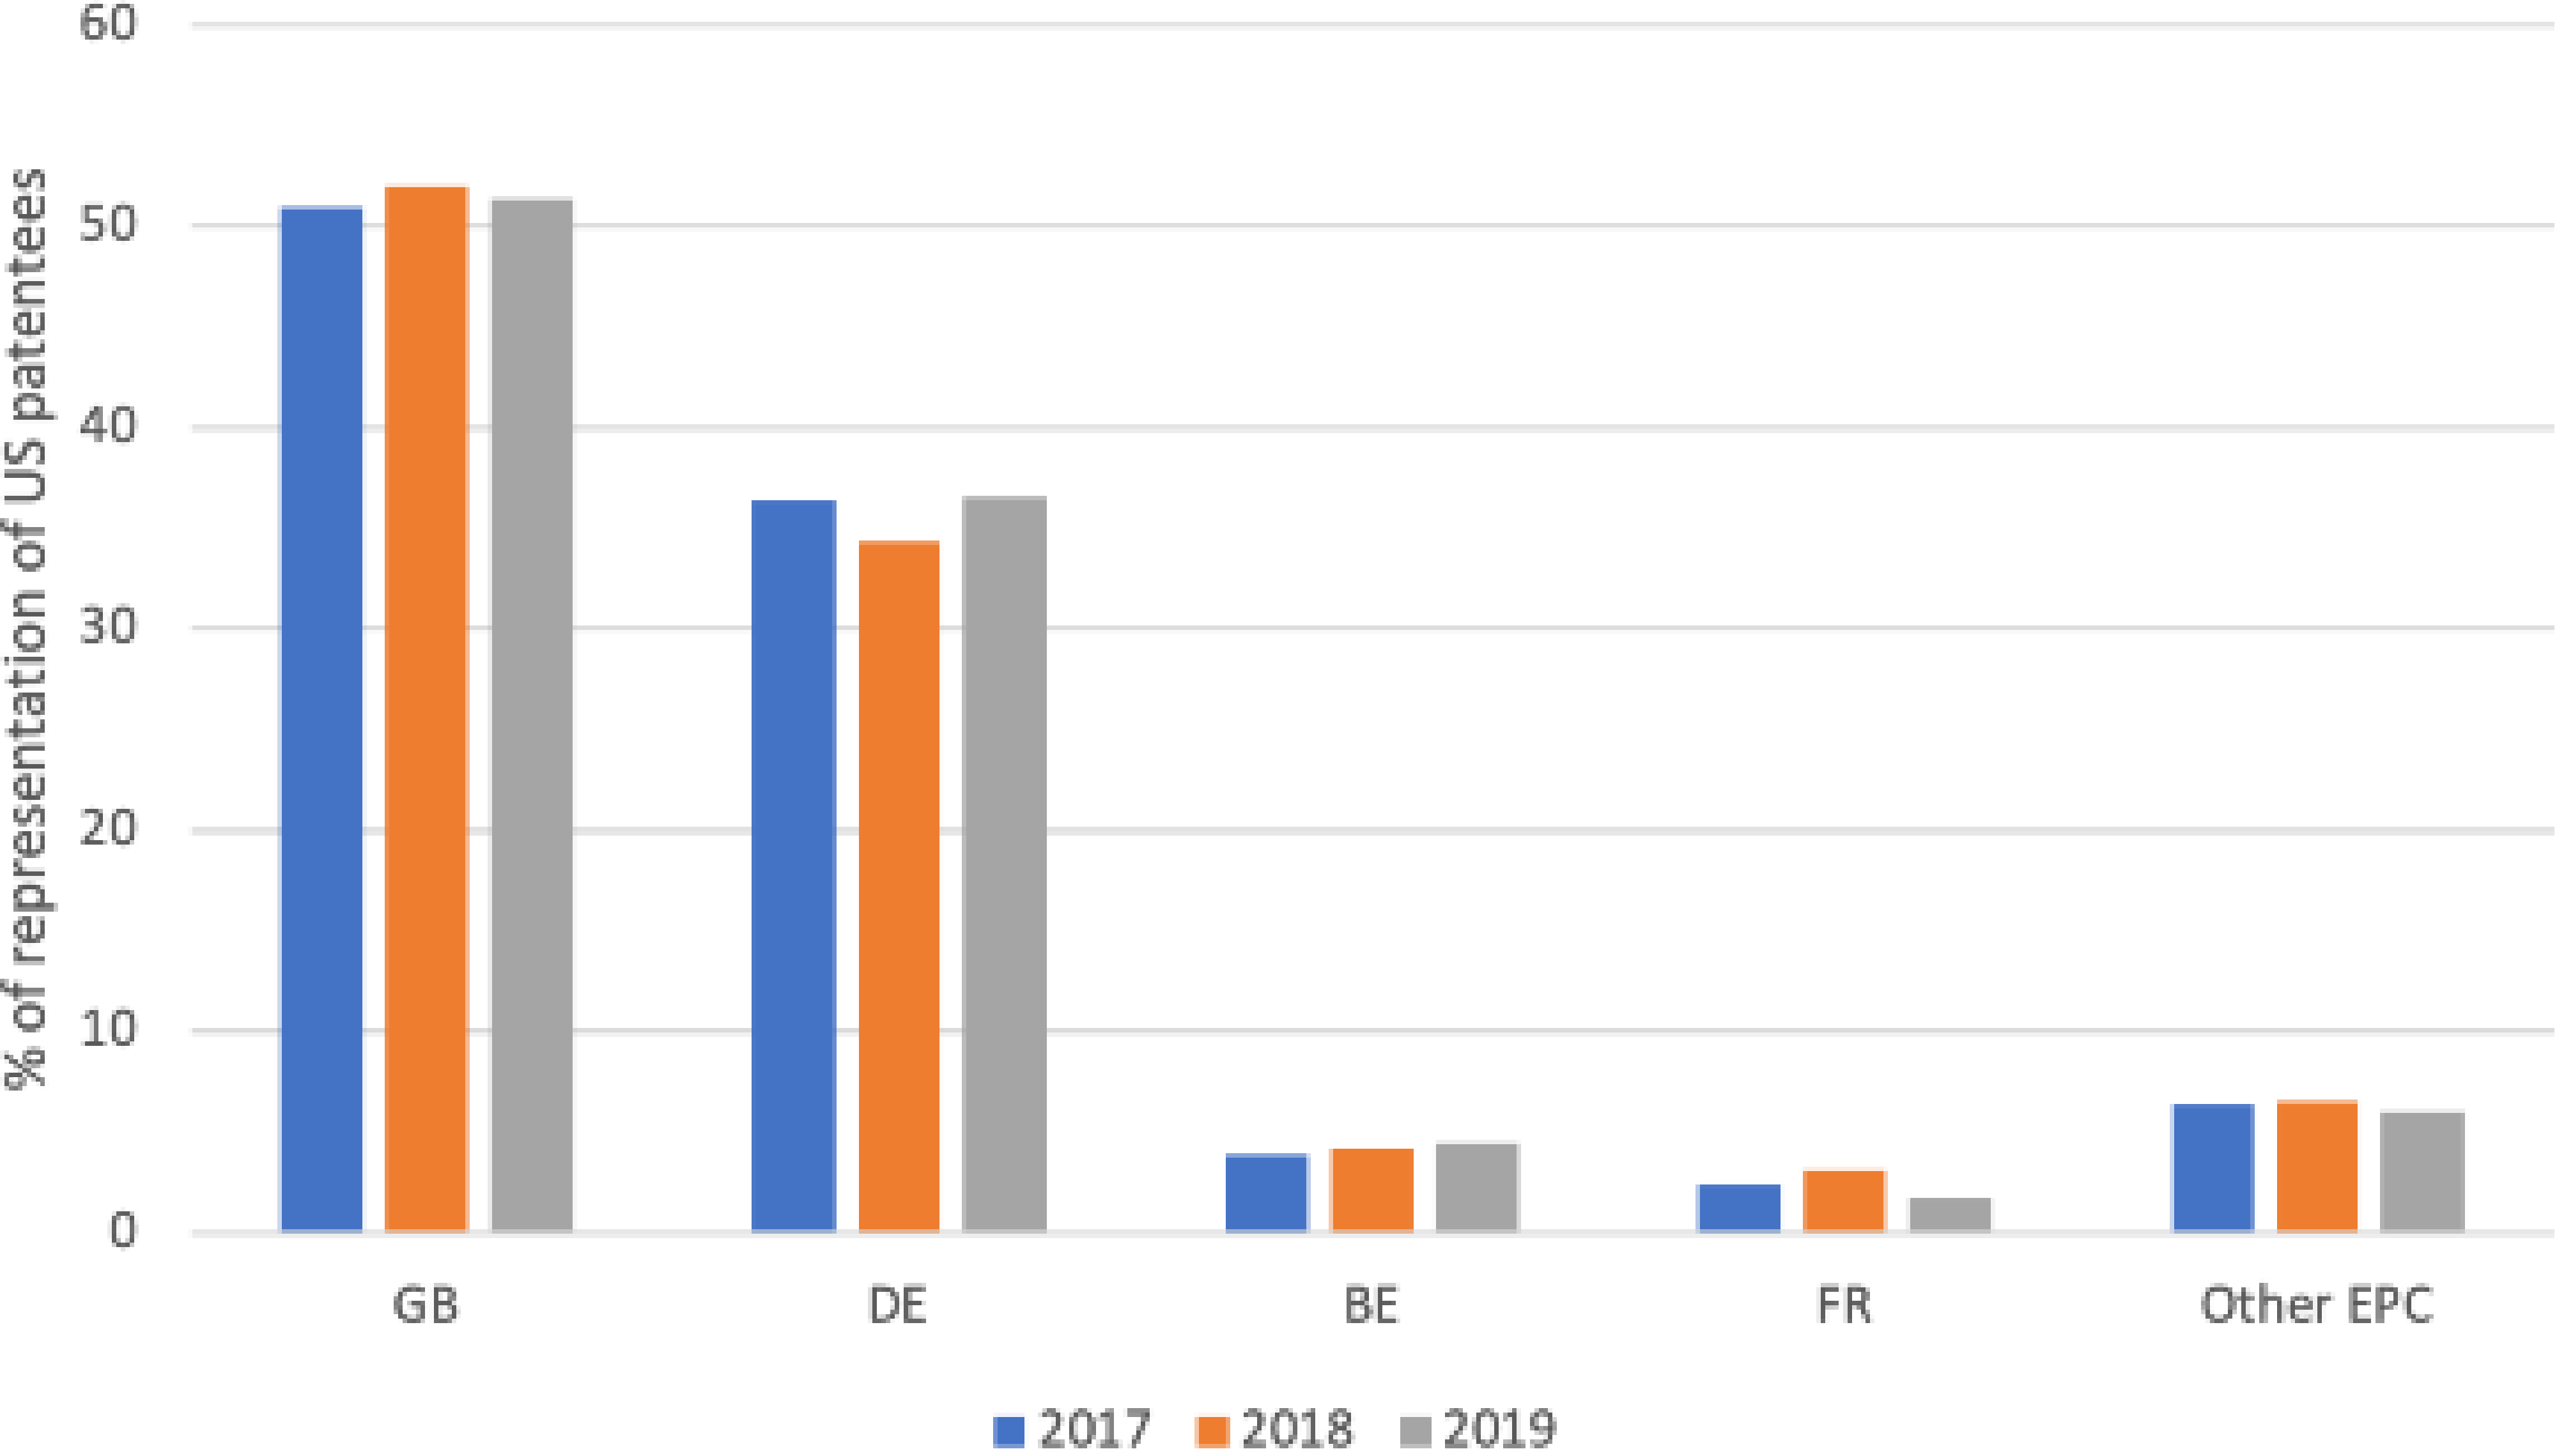
Figure 8 represents the choice of representative nationalities by US patentees in EPO opposition during the 2017-2019 period. Unsurprisingly, the UK is where US patentees look to the most. Consistently, over 50% of US patentees choose a UK representative. That said, German representatives still take a reasonable share, with percentages oscillating around a respectable 35%. Much further away, Belgium is third with an upward trend from 3.9% in 2017 to 4.5% in 2019, while France is fourth at about 2.5 %. The rest of the EPC countries’ representatives are all below 1% of total opposition procedures by US patentees and taken together consistently account for just over 6% of the total US patentee representation, mostly by the Netherlands, Switzerland, Sweden, Denmark and Italy.
Figure 9 Choice of representative nationalities by Japanese patentees in EPO Opposition during the 2017-2019 period.
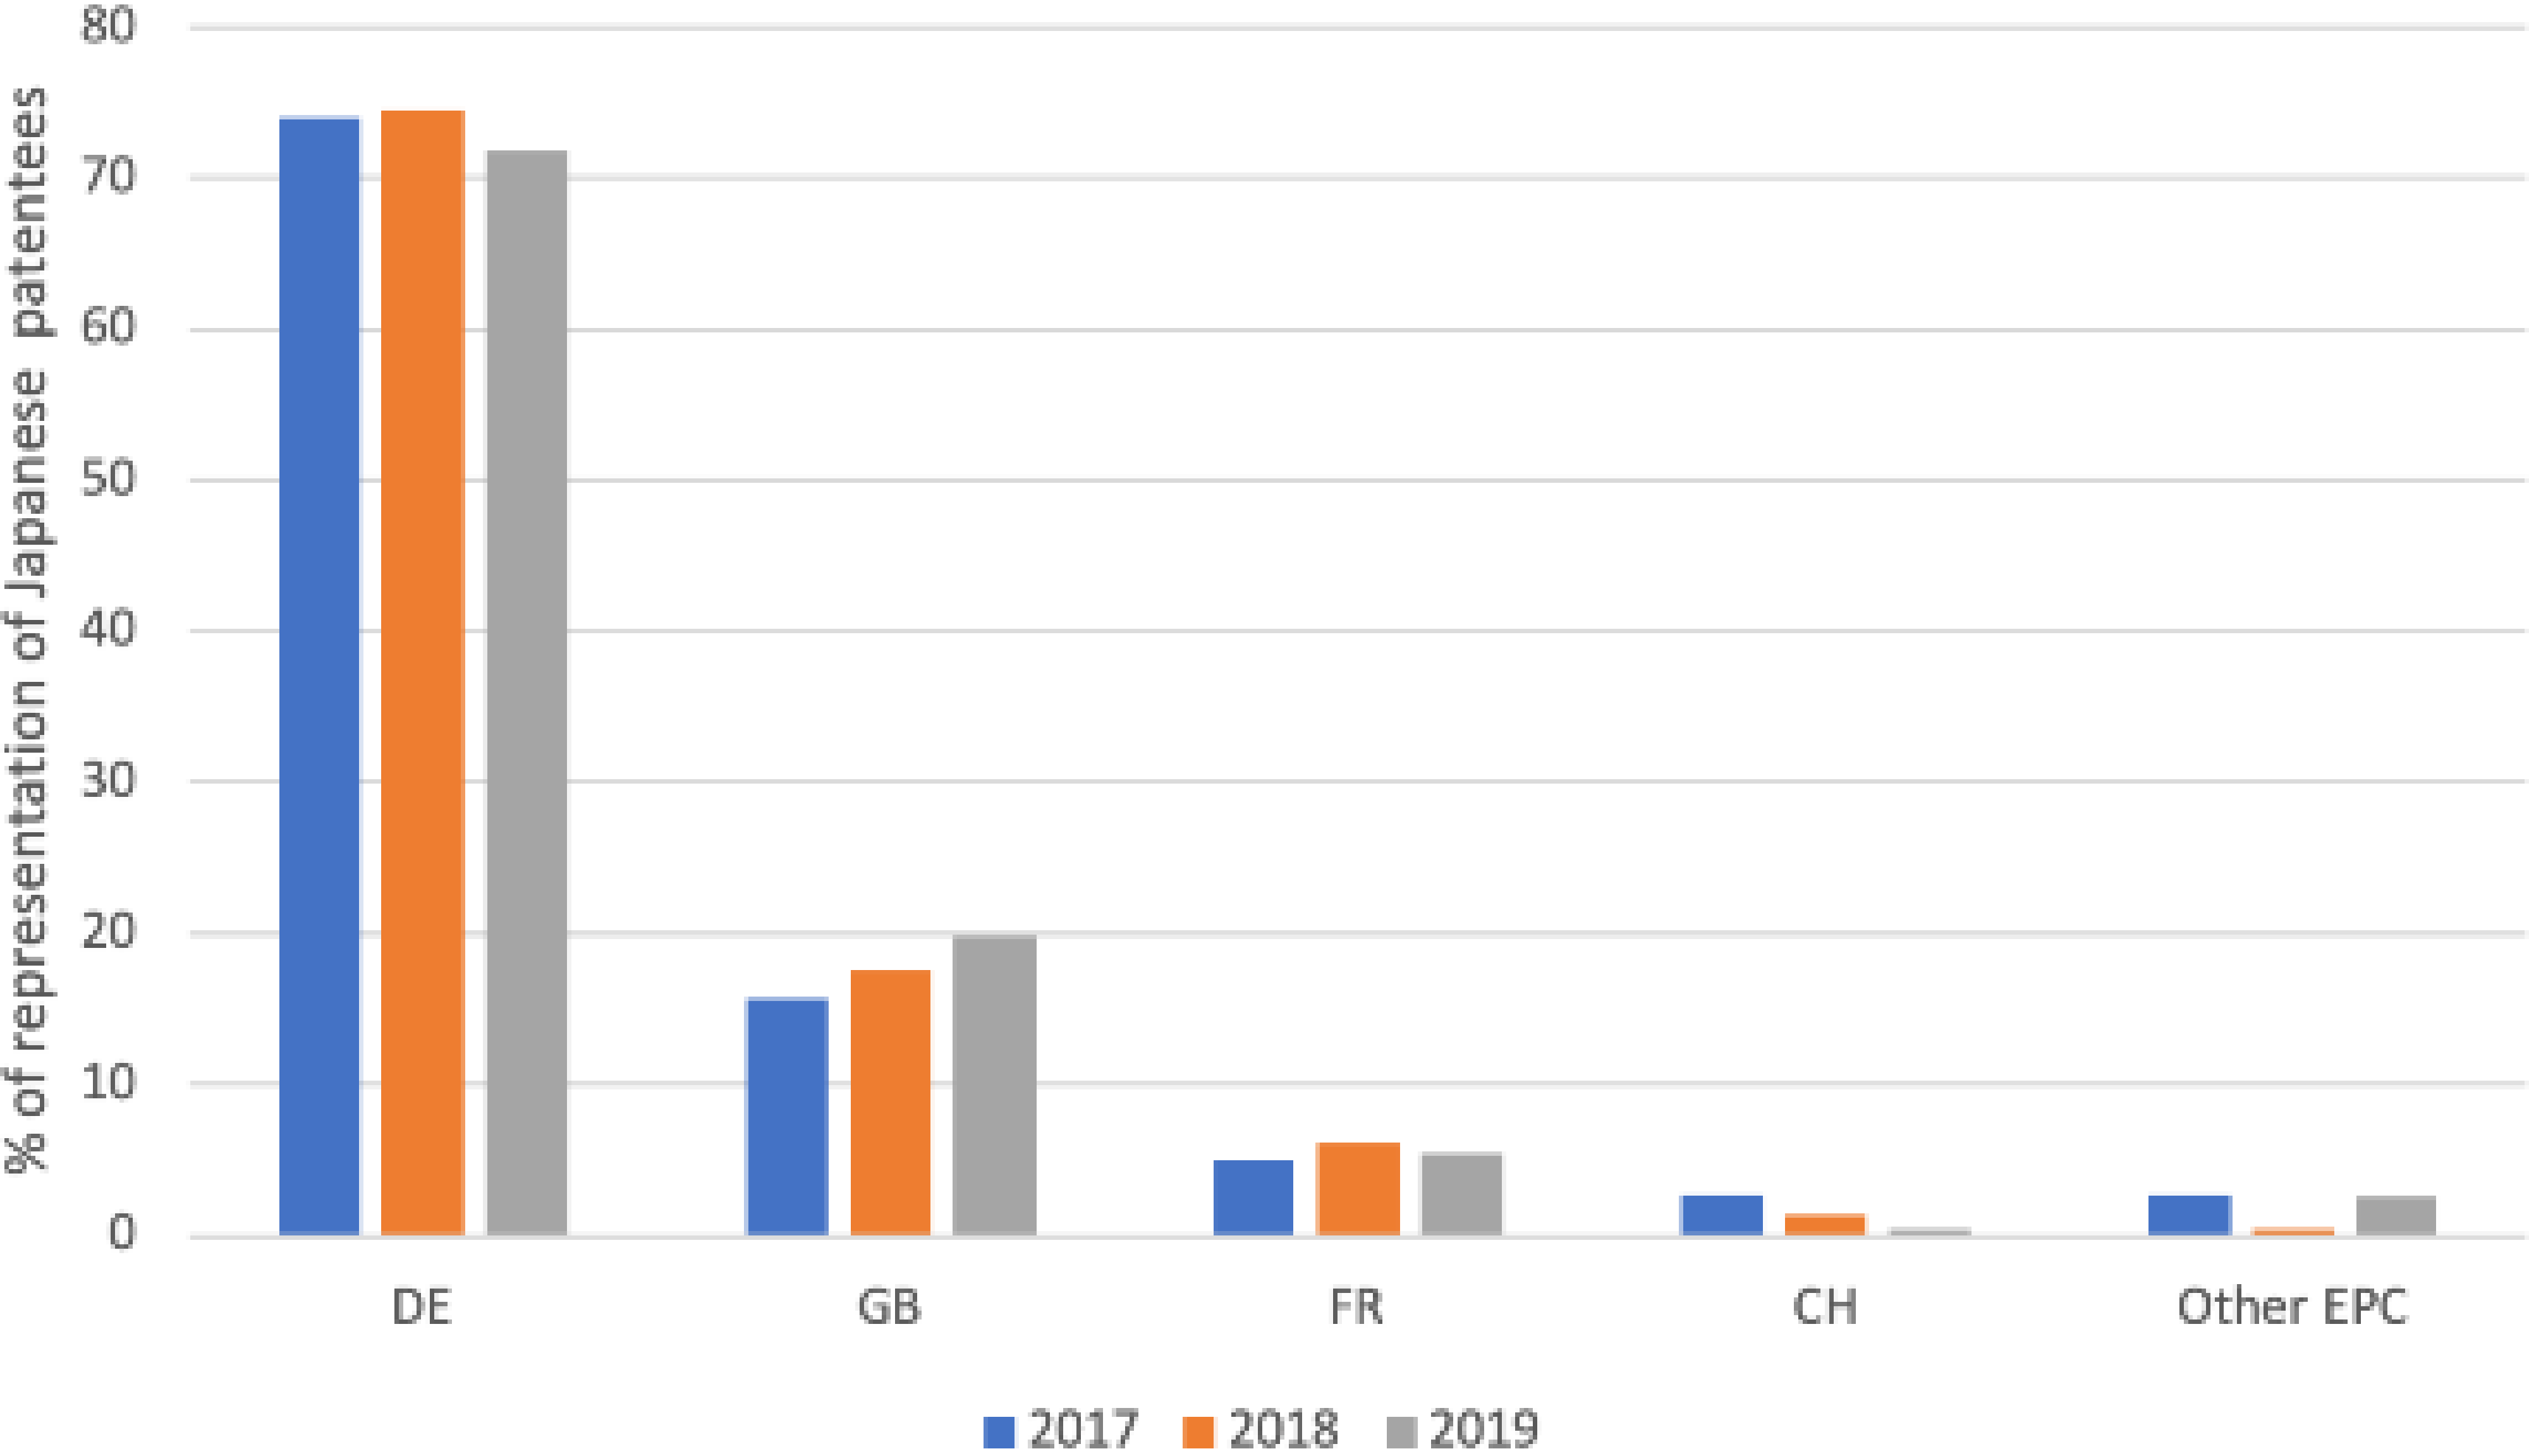
Figure 9 represents the choice of representative nationalities by Japanese patentees in opposition procedures before the EPO during the 2017-2019 period.
Contrary to the US, the clearly dominant is not the UK but Germany, which consistently represents nearly three quarters of Japanese patentees, although with a slight downward trend from 74% in 2017 to 71.7% in 2019. Much further away, the UK appears second, but shows a clear upward trend from 15.7% in 2017 to 19.8% in 2019. This may be indicative of a more equal Germany/UK representative ratio of Japanese patentees in the future.
At still lower levels, France is third, with percentages oscillating around 5% of the total amount. Switzerland ranks fourth and presents a downward trend from 2.7% in 2017 to only 0.4% in 2019. This is related to the high number of oppositions represented by Swiss representatives in 2017 for Panasonic as the patentee, which has declined significantly in 2019. The rest of the EPC countries only account for less than 3% of the total patentee representatives, mostly from Italy, the Netherlands, Sweden and Denmark.
OPPONENTS
We now turn to the opponents, which we have divided into two groups: those from EPC countries and from non-EPC countries. Figure 10 and Figure 11 represent the top EPC and non-EPC nationalities (respectively) of the opponents in EPO opposition during the 2017-2019 period. Regarding the first group (Figure 10), once more Germany clearly dominates and appears as the country with the highest number of opponents during the whole 2017-2019 period, although it again shows a downward trend from 46.2% in 2017 to 45.3% in 2019. These values are much higher than the percentages of German patentees (31% in 2017 to 27% in 2019). German opponents are followed by UK ones, with an upward trend from 7.5% in 2017 to 8.5% in 2019. Again, this percentage is much higher than for the UK patentees (from 3.9% in 2017 to 4.7%). While patentees at time stumble into an opposition procedure, opposing is a conscious decision. Thus, the dominance of opponents versus patentees in Germany and the UK indicate that German and UK companies are making an active use of the EPO opposition proceedings. Third and fourth are France and Switzerland, both presenting a steady trend at around 6% of the opponents throughout the 2017-2019 period. The Netherlands completes the top five with steady values of around 4%.
Figure 10 Top 10 EPC opponent nationalities in EPO opposition during 2017-2019.
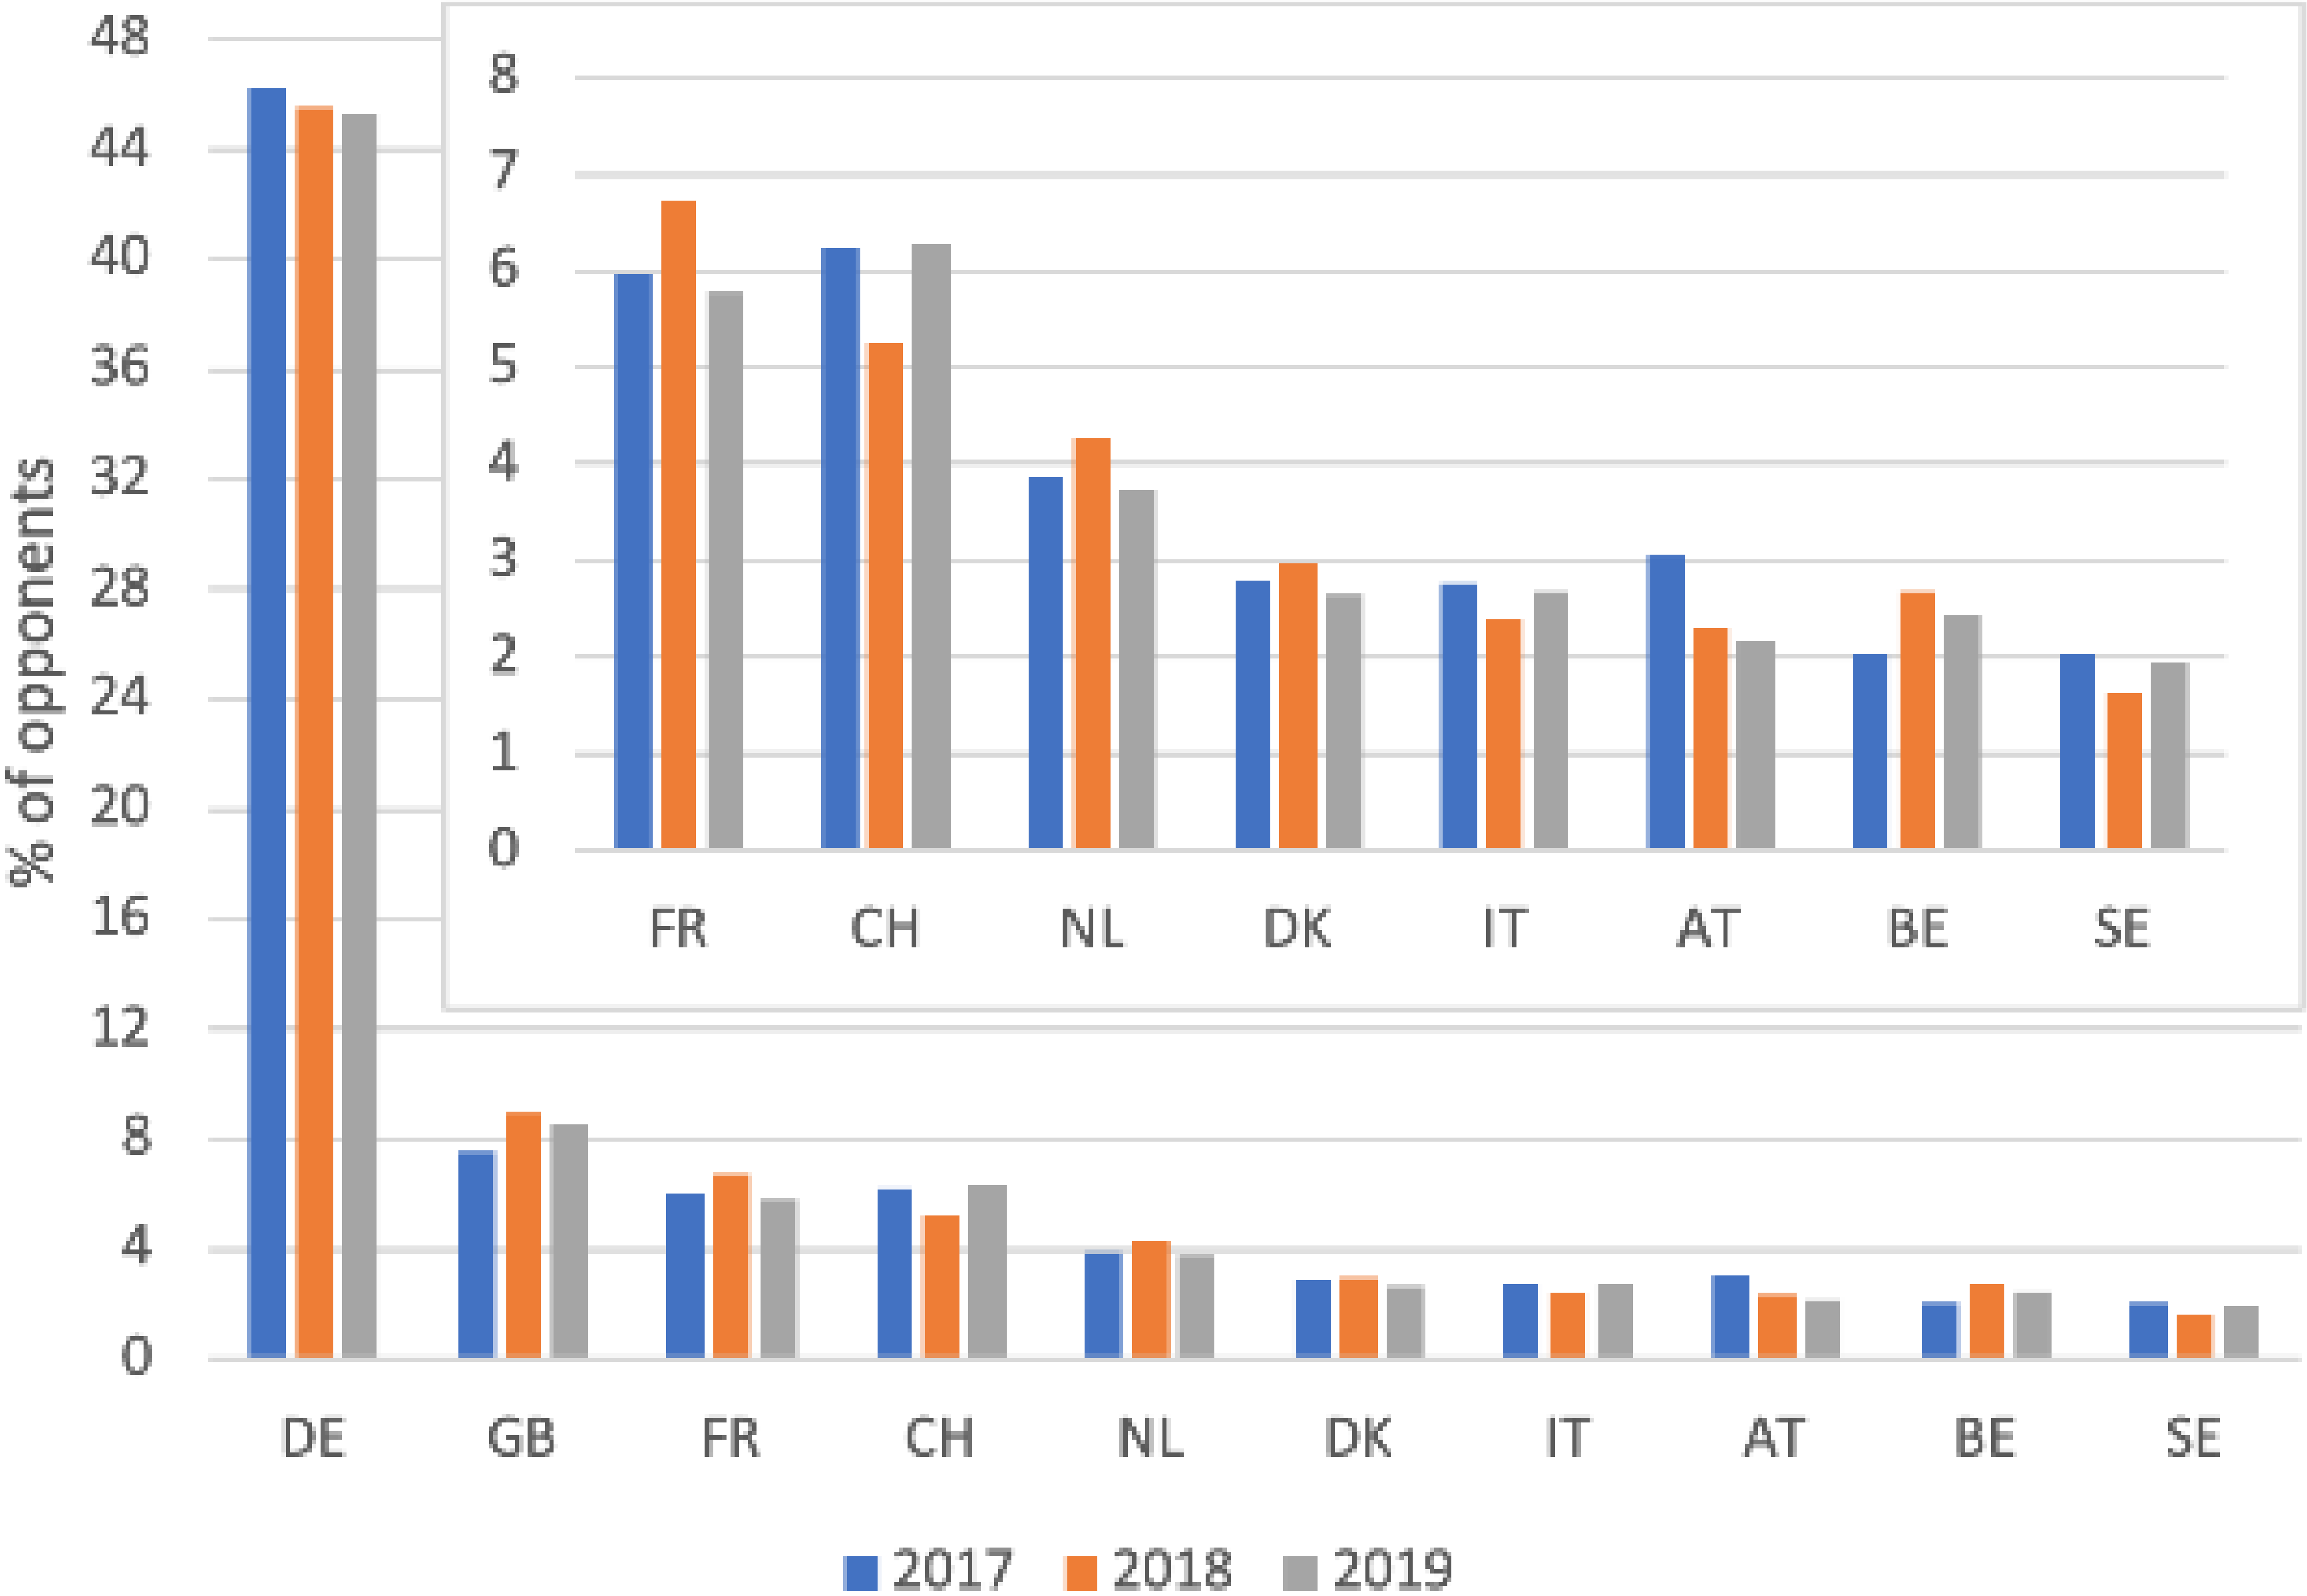
Figure 11 Top 10 non-EPC opponent nationalities in EPO opposition during 2017-2019.
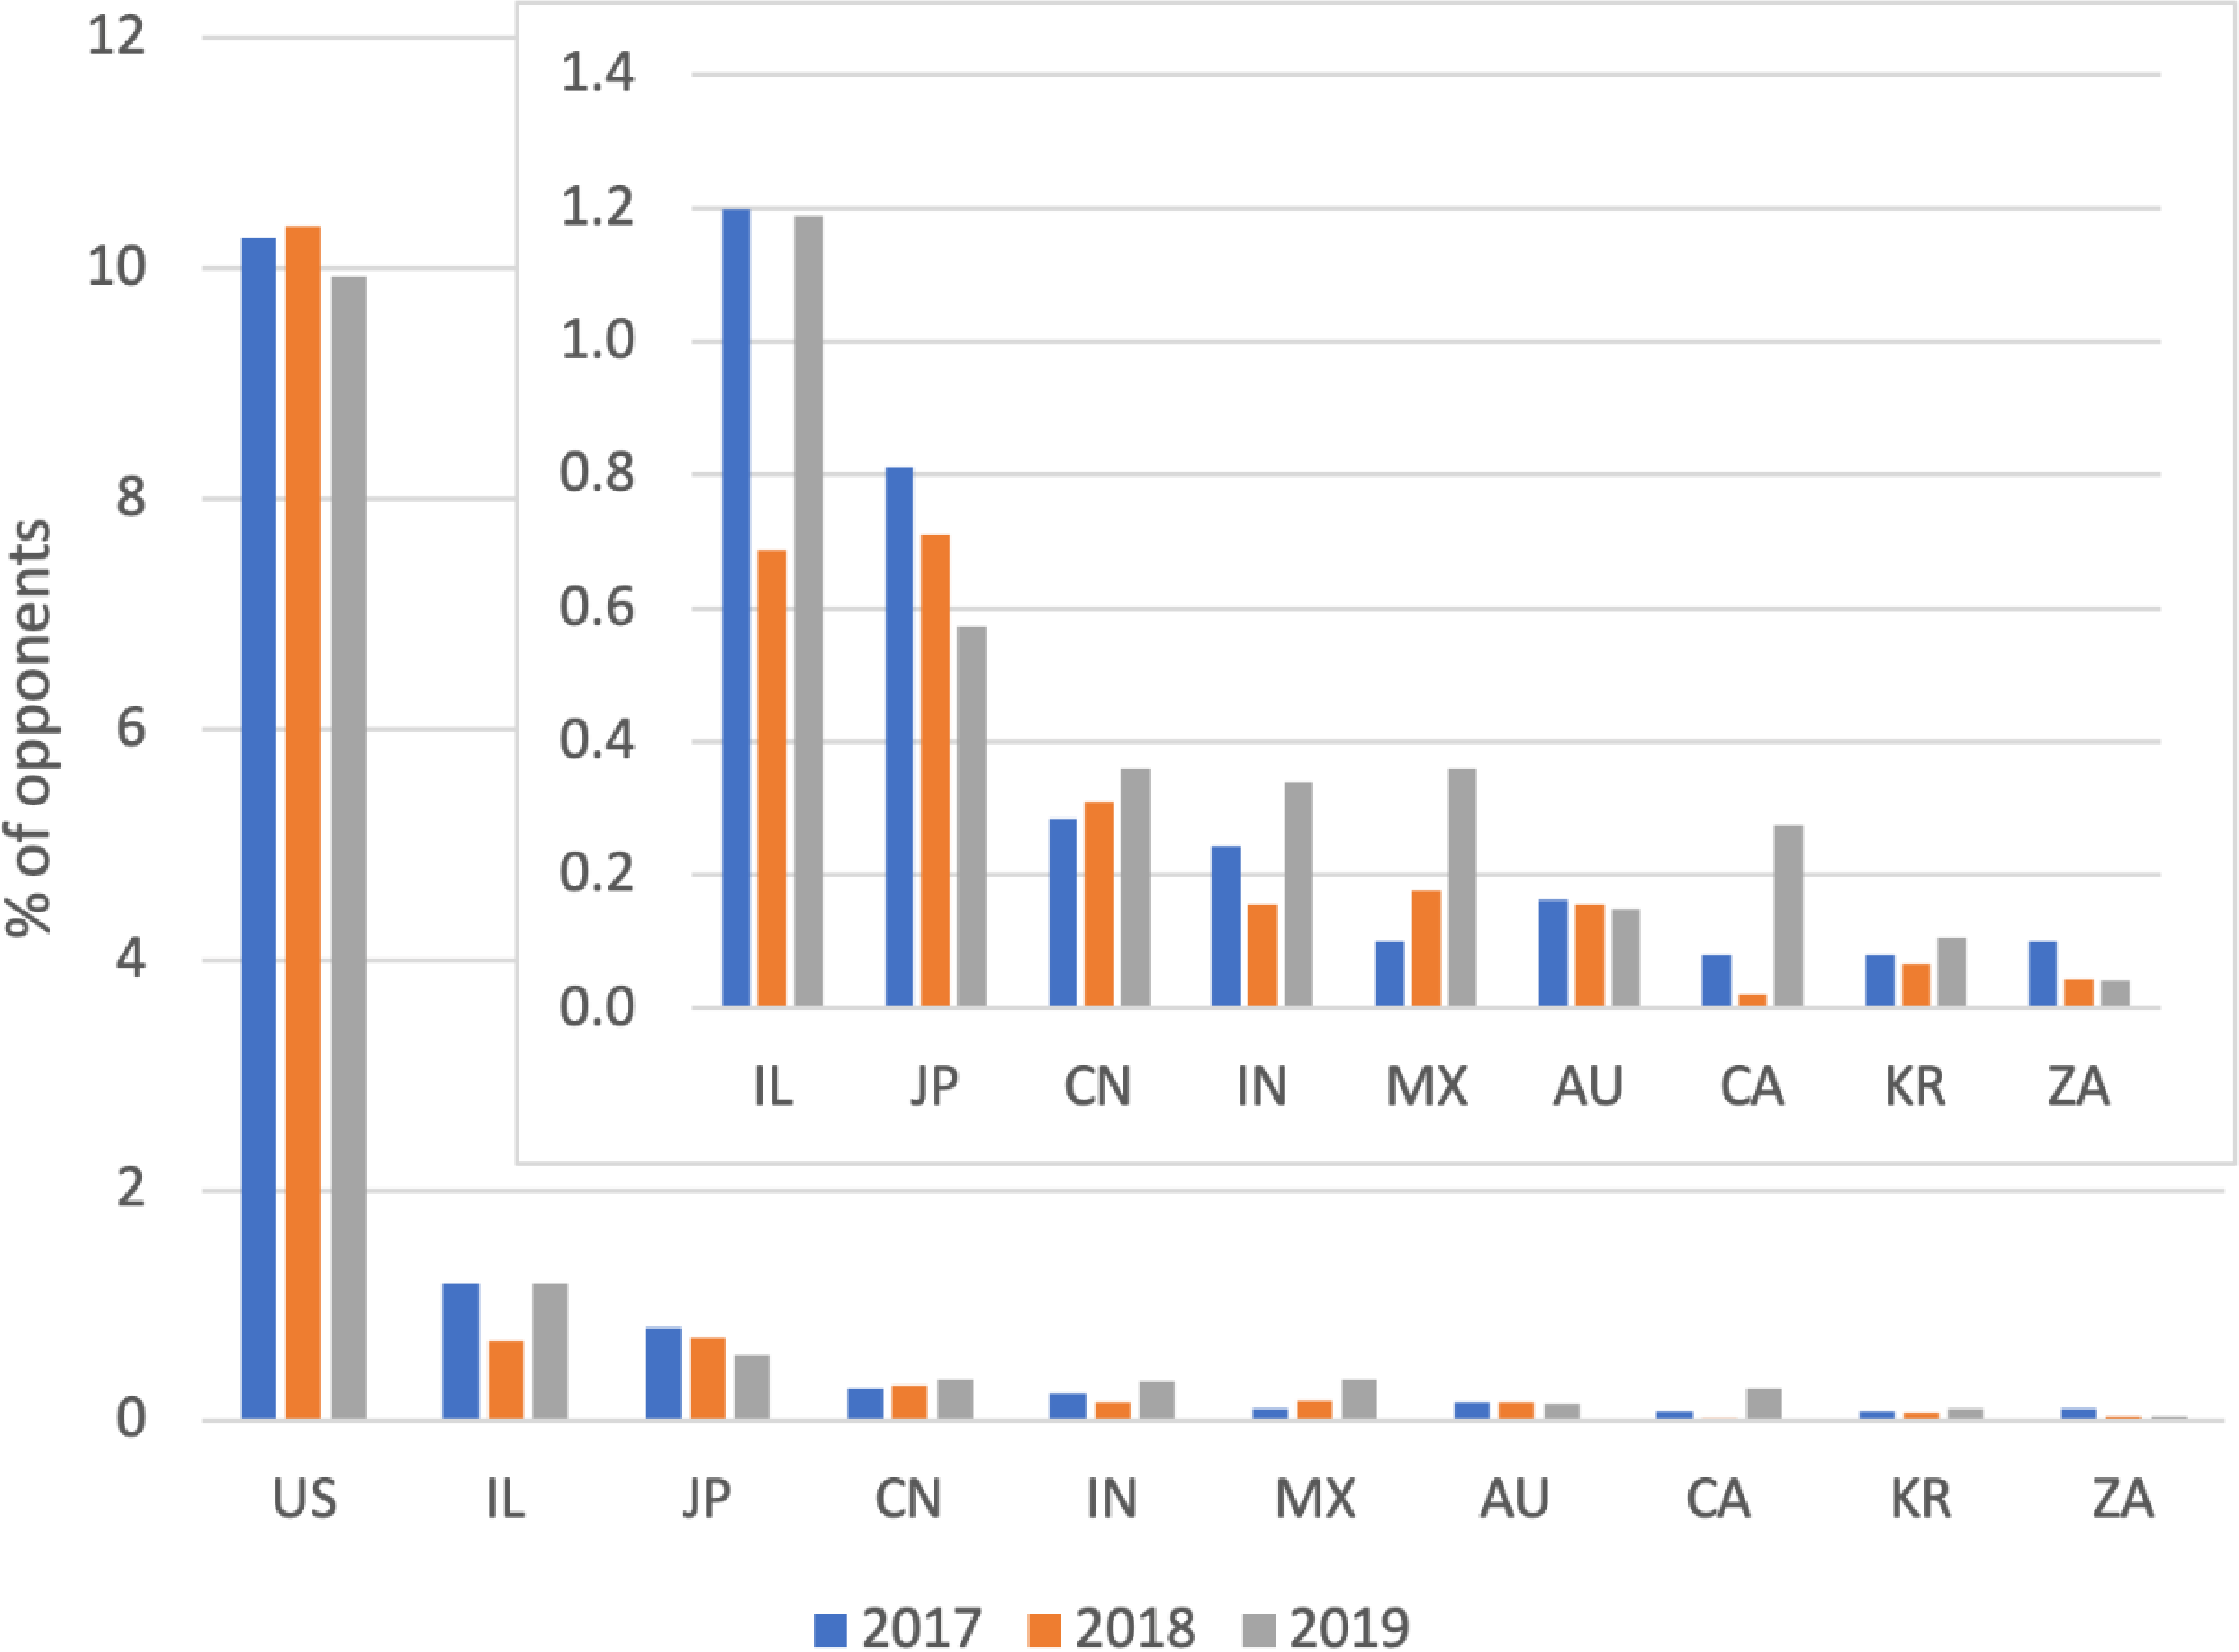
Regarding opponents from non-EPC countries (Figure 11), once more the US is the clear winner, with the second overall position right after Germany and with steady percentages oscillating around 10% during the period 2017-2019. However, these values are less than half the percentage of US patentees in the same period (around 21.5%). Thus, twice as many patents from US companies are being opposed than patents actively opposed by US companies. This trend also appears for Japanese opponents (third with around 0.7% of the opponents) versus Japanese patentees (around 6.5% of the patentees). This may be indicative of US and Japanese companies making less active use of EPO opposition procedures, rather than actively attacking EP patents.
Notably, Israel is the second non-EPC country providing opponents, ranking above Japan. Remarkably, Israel has a higher percentage of opponents (around 1%) than patentees (around 0.4%, in sixth position among non-EPC countries) in EPO oppositions. The top five is completed by China (fourth) and India (fifth), percentages of opponents for both slowly increased through the 2017-2019 period, but in absolute numbers they only have a small share (China 0.4% and India 0.3% in 2019) . This upward trend also appears for opponents from Mexico (sixth with 0.4% in 2019). Overall, non-EPC countries are almost three times more involved in EPO opposition as patentees (i.e. the opposition is filed against them), with an average of 35% during the 2017-2019 period, rather than through active involvement as an opponent, with an average of only around 13% over the same period. This could be due to, among other things, unfamiliarity with the EPO opposition system or lack of intense commercial activity in Europe. For those companies for which the former applies, an increased awareness of the opposition procedure before the EPO could be highly beneficial.
Figure 12 Opponent representative nationalities in EPO Opposition during 2017-2019.
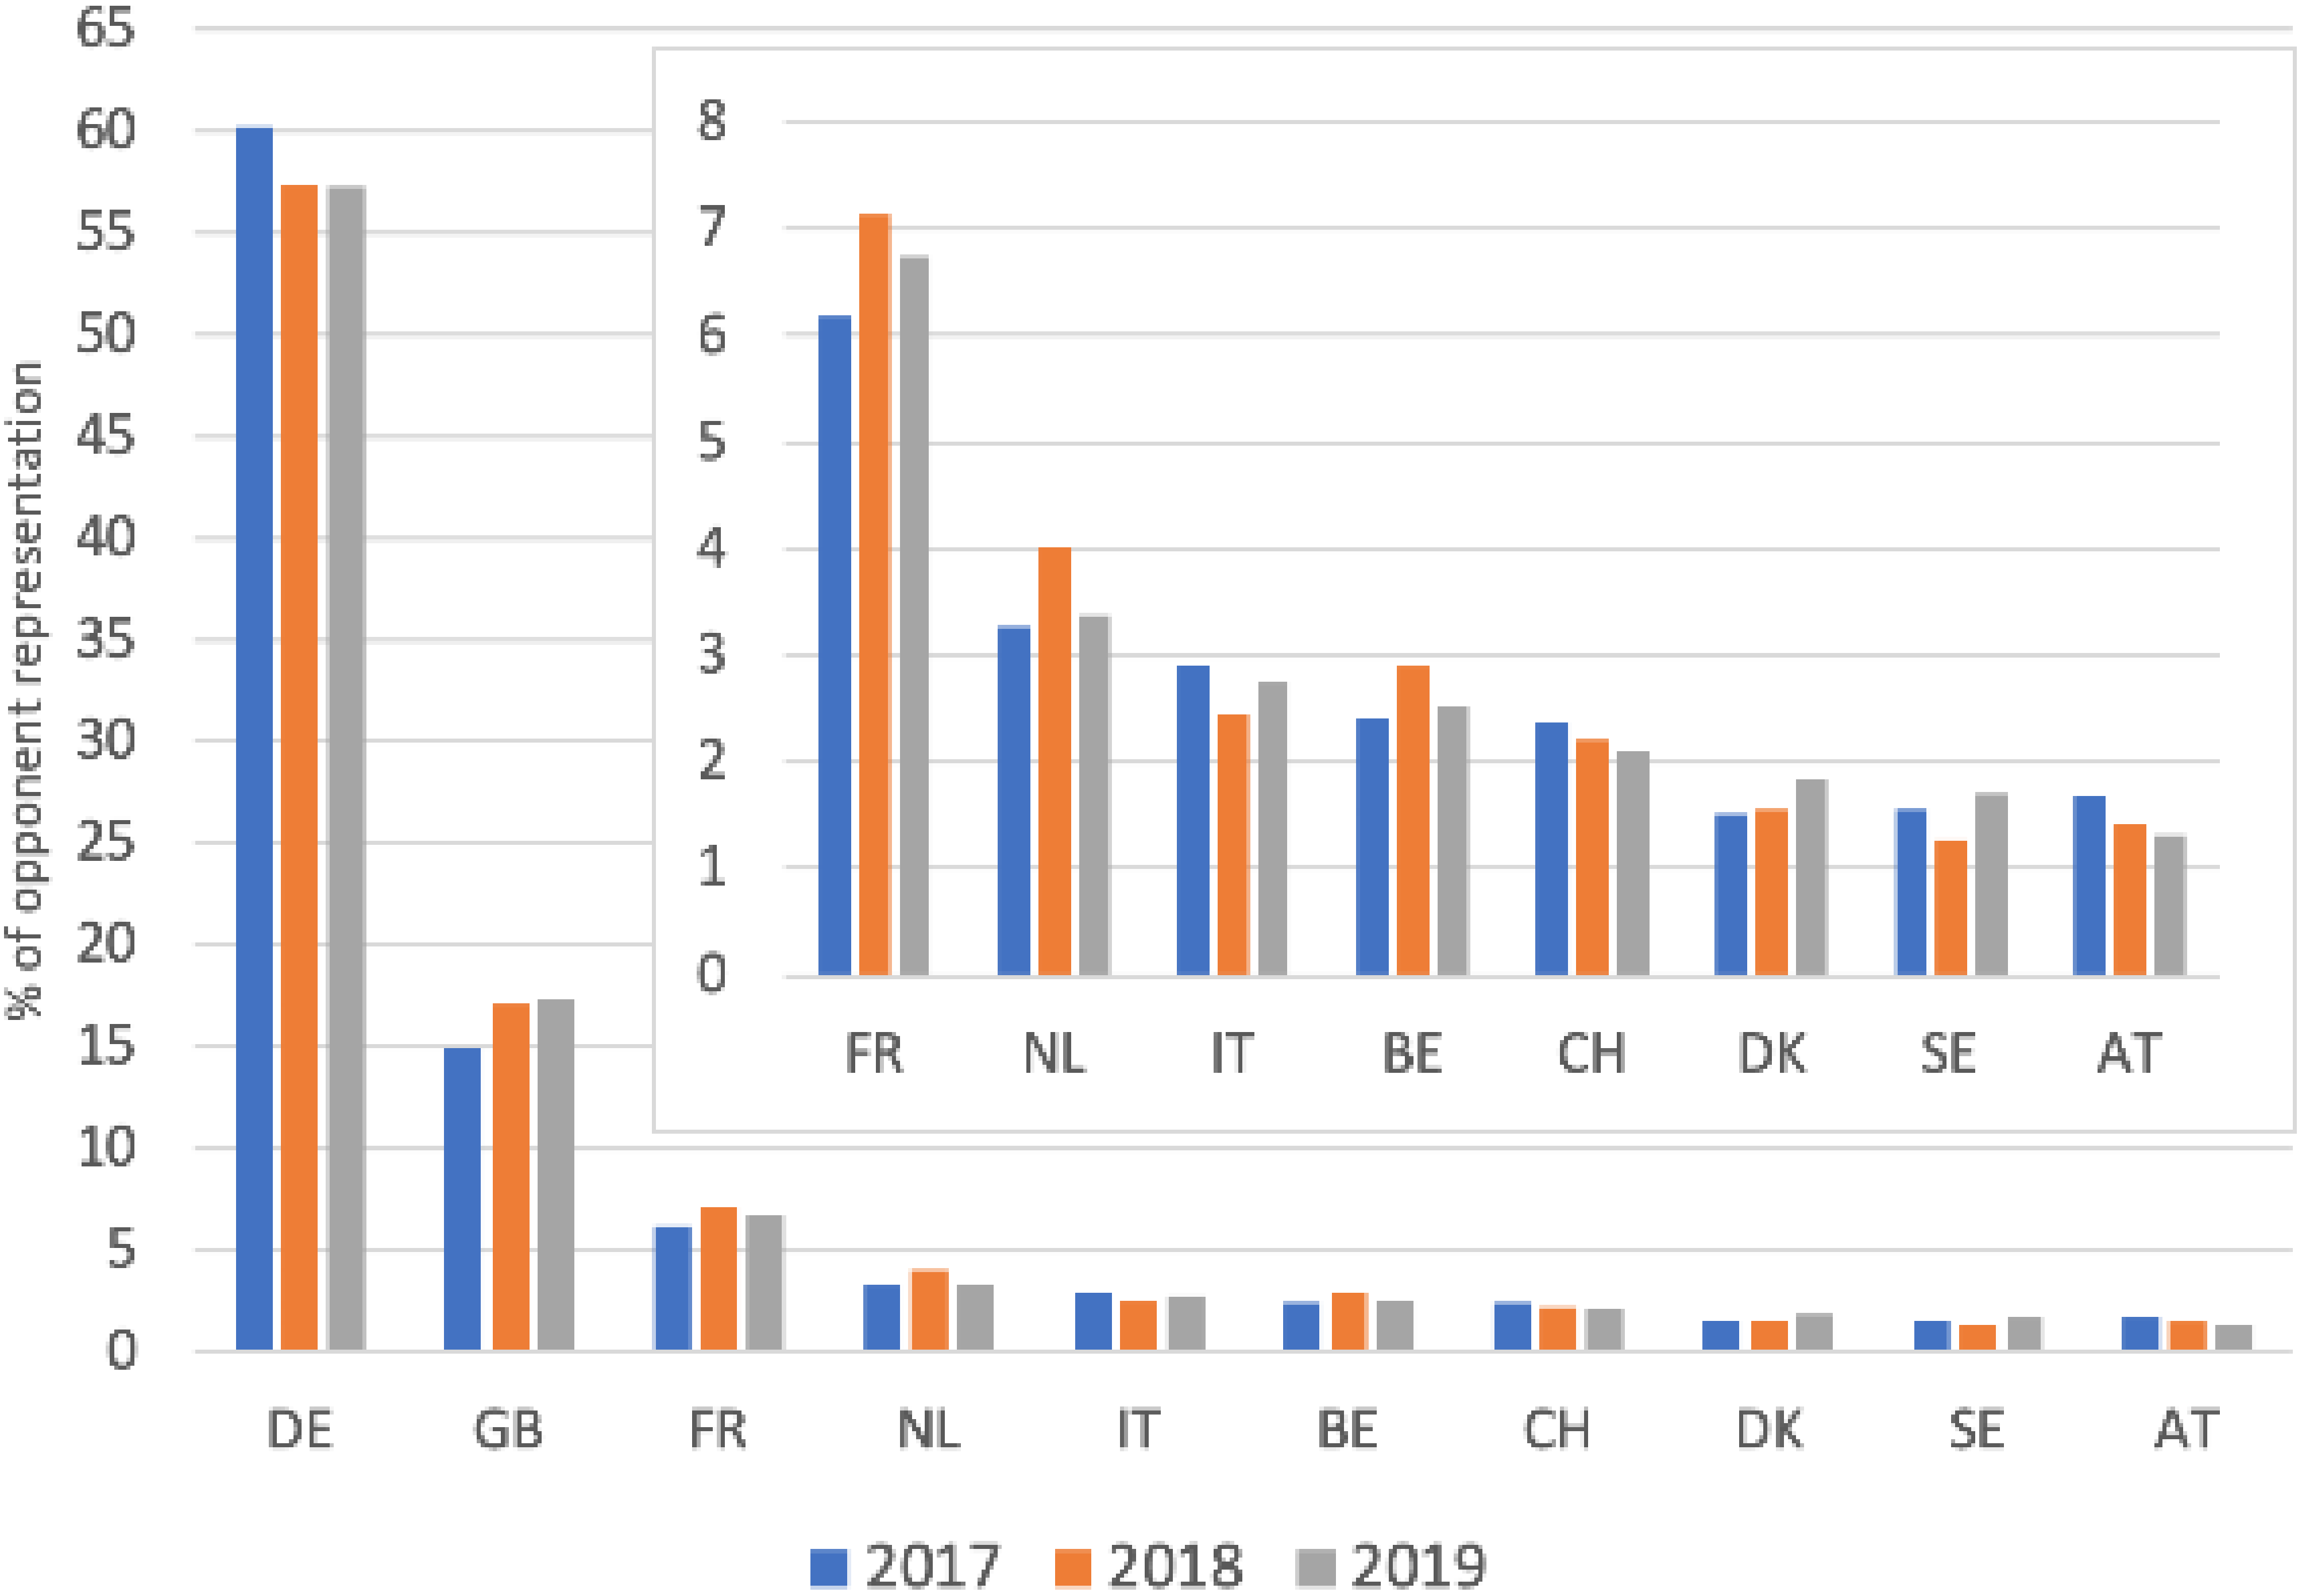
Figure 12 represents the choice of opponent representative nationality in EPO opposition during the 2017-2019 period. German representatives are the clear preferred choice, with an impressive but decreasing figure of 60.3% in 2017 to 57.3 % in 2019. These figures are higher than those of German opponents (46.2% of in 2017 to 45.3% in 2019), which indicates that non-German opponents are prone to choose German representatives as well. Despite the downward trend, the figures are still impressive and show how much German patent attorney firms dominate both the opponents and the opponent representatives at opposition procedures before the EPO, to an even greater extent than acting as patentees or patentee representatives.
Although far below Germany, the UK stands out as the second country in terms of opponent representatives, and its percentage has increased from 15% in 2017 to 17.3% in 2019. These values are about twice as high as the values of opponents from the UK (7.5% in 2017 to 8.5% in 2019), which indicates that, just as for Germany, opponents from countries other than the UK are choosing UK representatives. Contrary to Germany, the UK opponent representation numbers are lower than those for patentee representation (Figure 3, around 21.2% in 2017 to 21.7% in 2019). This points to UK representation being preferred by patentees rather than opponents.
France is third and the Netherlands is fourth, accounting for around 6% and 4% of the opponent representatives throughout the 2017-2019 period, respectively. These figures are similar to those of the opponents from those nationalities, with the ratio of opponent/opponent representative almost completely balanced. This trend is also followed by Italy, which is fourth with around 2.5% of both opponents and opponent representatives. However, although Switzerland presents a similar percentage of opponents to France (fourth with around 6% during 2017-2019), only around 2% of opponent representatives are from Switzerland (sixth during 2017-2019). This highlights that at least two-thirds of Swiss companies acting as opponents look for representation abroad.
GERMANY DOMINANT, BUT THE UK CLIMBING
The top patentee and patentee representative nationalities or opponent and opponent representative nationalities ranking remained largely unchanged from 2017-2019, with Germany occupying the top spot for both patentees and opponents, as well as patentee and opponent representation during the whole 2017-2019 period, especially dominating in number of opponents and opponent representatives. However, while the currently impressive Germany dominance is decreasing, the UK one appears to be increasing, which may hint towards a more UK-centred scenario to the detriment of Germany in the future. After Germany and the UK, France, the Netherlands and Italy complete the top 5 European countries in terms of both patentee and opponent representation when looking at the entire three-year period. Regarding non-EPC countries, the US and Japan account for most of the patentees and opponents from non-EPC countries, but their relevance is much higher when acting as patentees. For patentee representation, the US mostly looks to the UK, but with a consistently high German representation as well. By contrast, Japanese patentees mainly choose German representatives, with the UK following a long way behind. Nonetheless, the UK is becoming consistently important in the representation of Japanese patentees.
This article first appeared on www.IAM-media.com, published by Law Business Research - IP Division.

